Levenmouth area profile
This section provides an area profile of Levenmouth, with the following topics covered: population, deprivation, health and education.
Unless stated otherwise, the data in this section is reported at the Levenmouth boundary level, i.e. the immediate populated urbanised settlements of Leven, Methil, Buckhaven, Windygates and Kennoway.
Population
Data in this section is sourced from the National Records of Scotland (NRS), utilising 2011 Scotland Census data zone small area estimates.
The population of Levenmouth in 2020 (using settlement boundaries) was 30,700, making it the 25th largest settlement by population in Scotland and the fourth largest in Fife. Both the populated areas of Leven, which is situated north of the River Leven, and Methil found to the south of the River Leven, make up the majority of the population within Levenmouth, with populations of approximately 9,420 and 10,890, respectively. Buckhaven, which is found to the south of Methil, has a population of approximately 4,050.
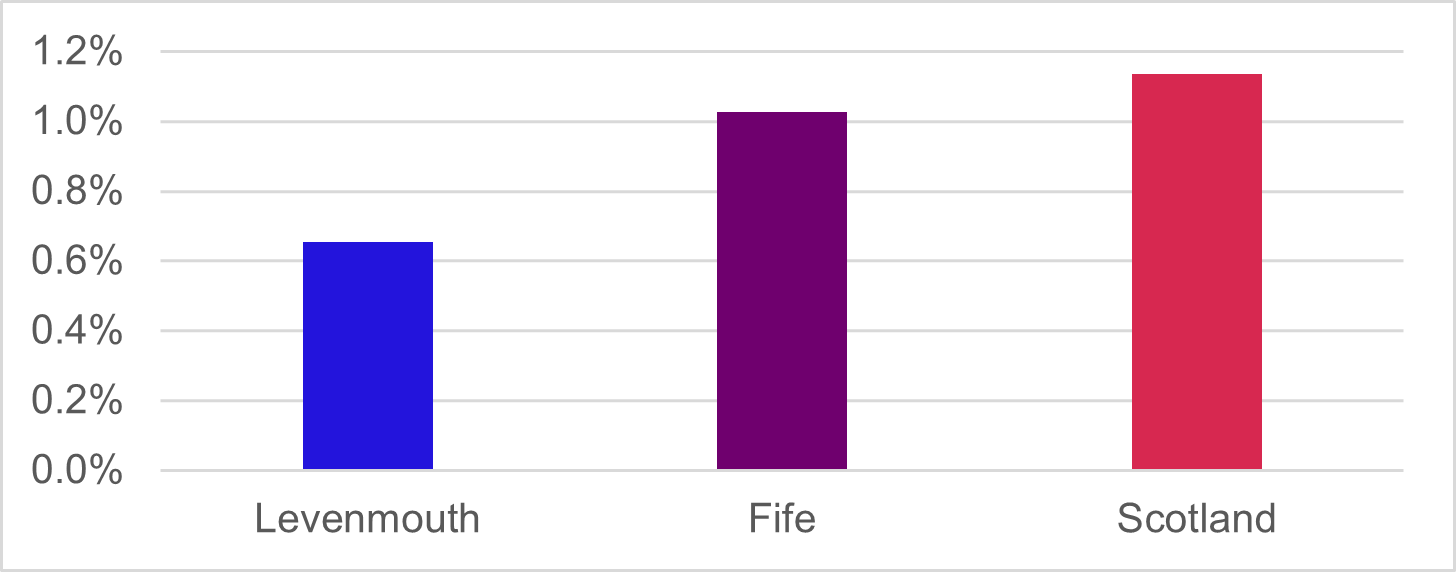
The population in the Levenmouth has observed a small increase in recent years, with an increase of approximately 200 people when comparing 2016 values to 2020. This represents a 0.7% population increase over the 4-year period. Levenmouth showed a smaller population increase compared to Fife (1.0%) and Scotland (1.1%) over the same period, as shown in Chart 3‑1.
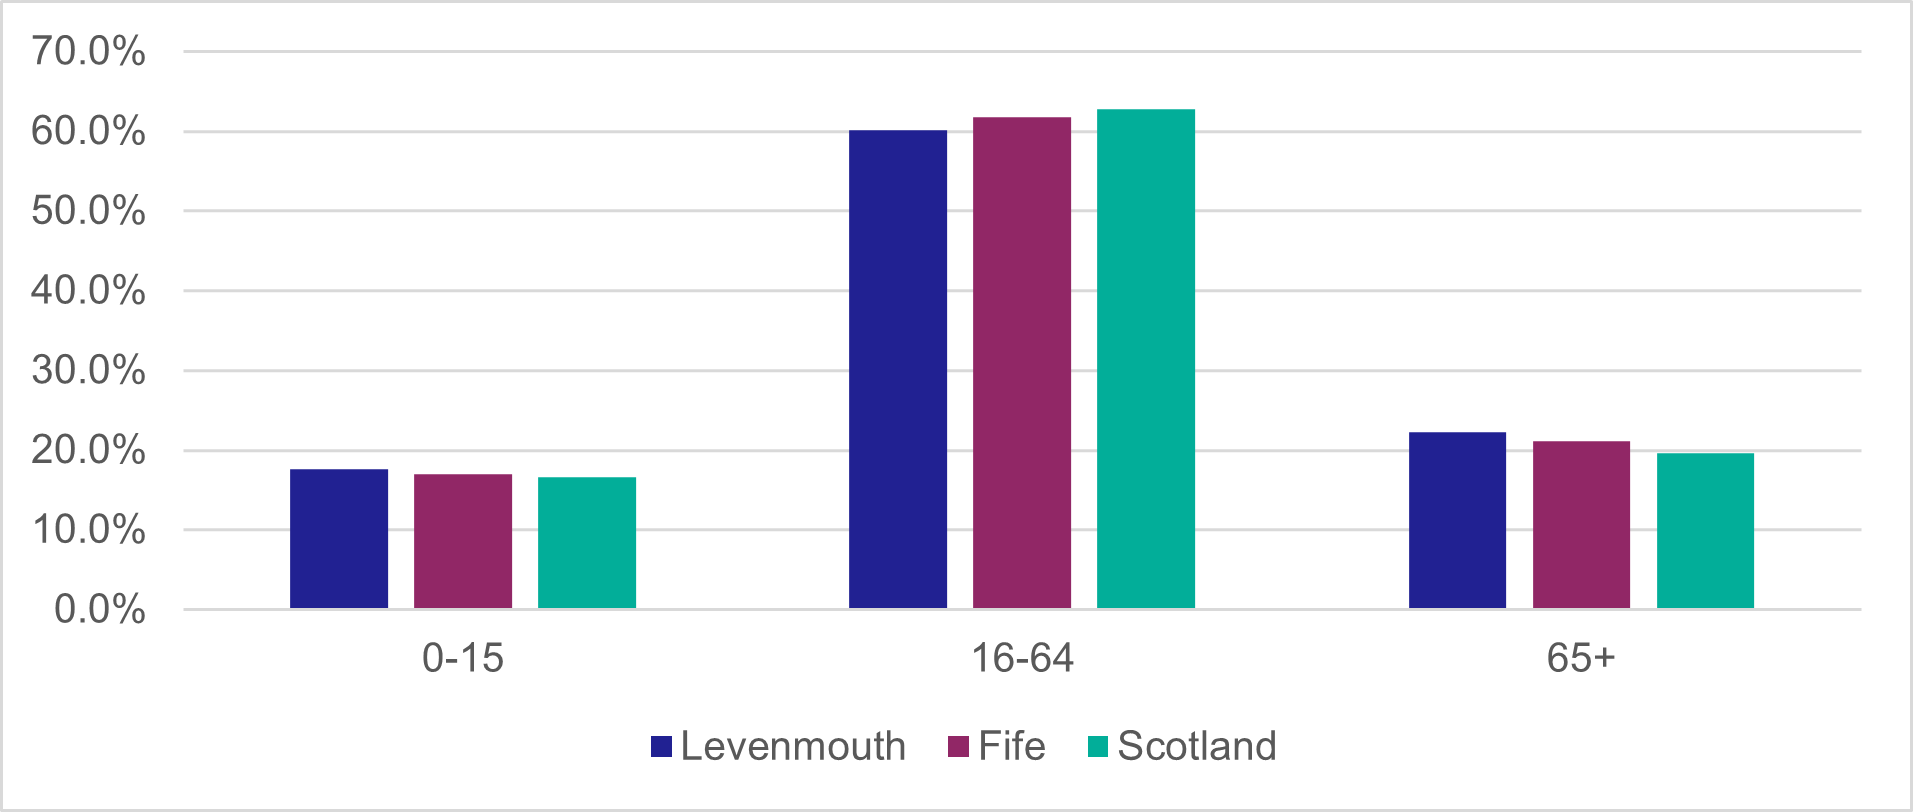
Levenmouth has a similar percentage of younger people (under 16) and older people (65 and over) to both Fife and the rest of Scotland. This is demonstrated in Chart 3‑2, which shows population age structure within Levenmouth alongside a comparison to Fife and Scotland. Levenmouth has a working age population of 60.1%, similar to Fife and Scotland (61.8% and 62.7%, respectively).
Deprivation
The Scottish Index of Multiple Deprivation is a relative area-based measure of deprivation across the country and is constructed for small geographic areas (data zone level). The measure of deprivation is assessed across seven main domains: income, employment, education, health, access to services, crime, and housing. The overall level of deprivation is assessed by combining the relative rankings across the seven domains. The latest SIMD available is for 2020. Levenmouth is largely identified as deprived, with many areas in the most deprived 10% in Scotland across all domains except access to services. More details and a summary of SIMD domains are provided within the relevant sections throughout this chapter.
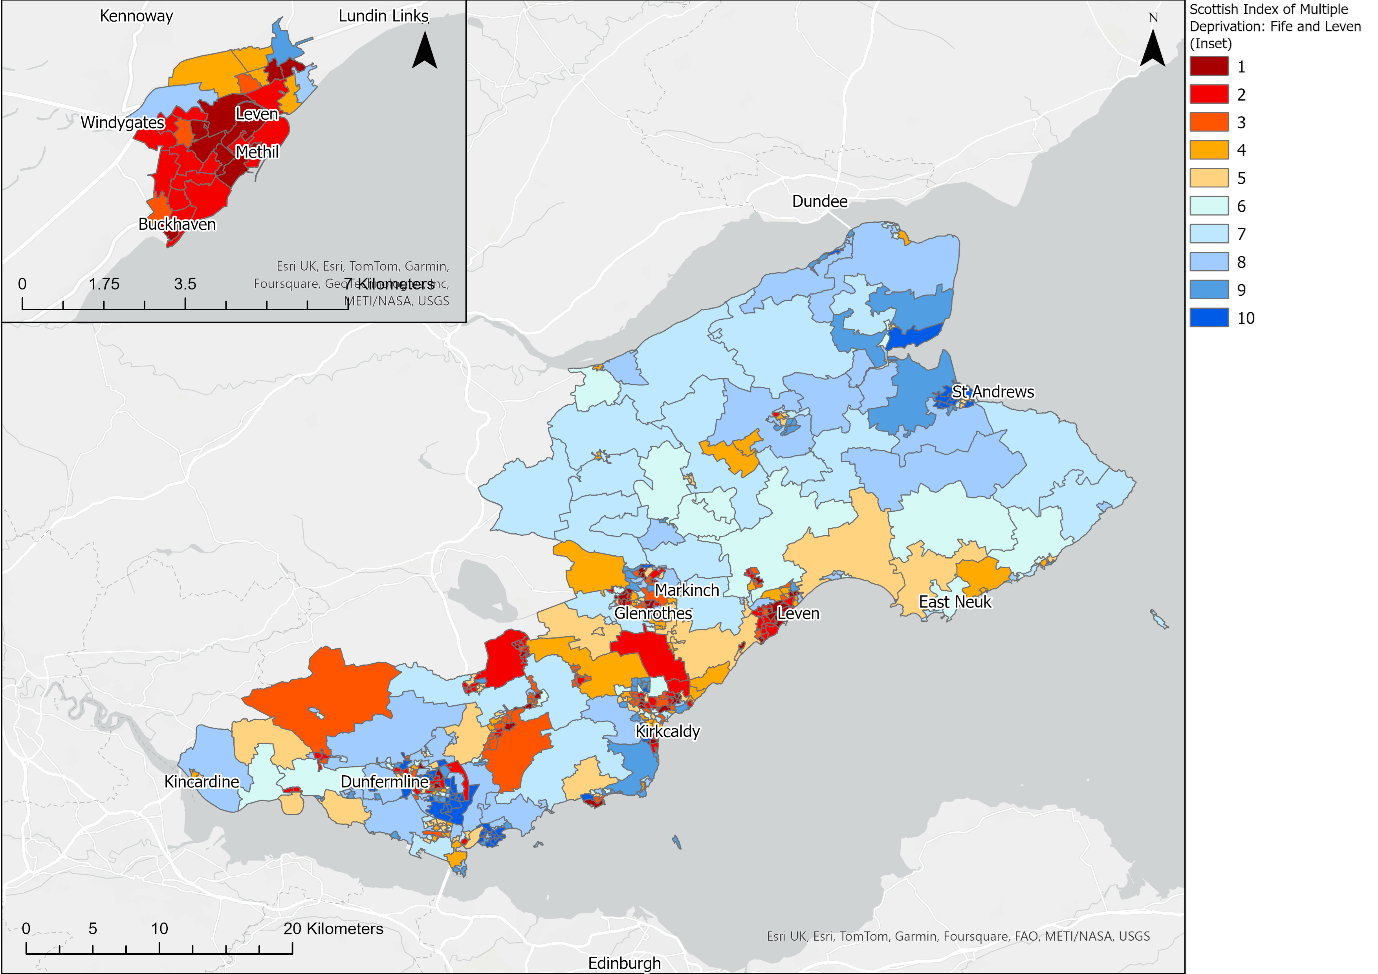
Levenmouth is also identified as being one of the more deprived areas within Fife, particularly when compared to settlements in the north and north-east of Fife. The overall index shows that 25 (54% of zones) of the Levenmouth area data zones are in the 20% most deprived nationally, compared to 20% in Fife. This equates to 52% of the Levenmouth population living in areas of relatively high deprivation, compared with 19% of the population in Fife, demonstrating the higher levels of deprivation within the settlement area. Figure 3‑1 shows that the Levenmouth area has a high concentration of deprived areas, particularly when compared to other parts of Fife.
Health
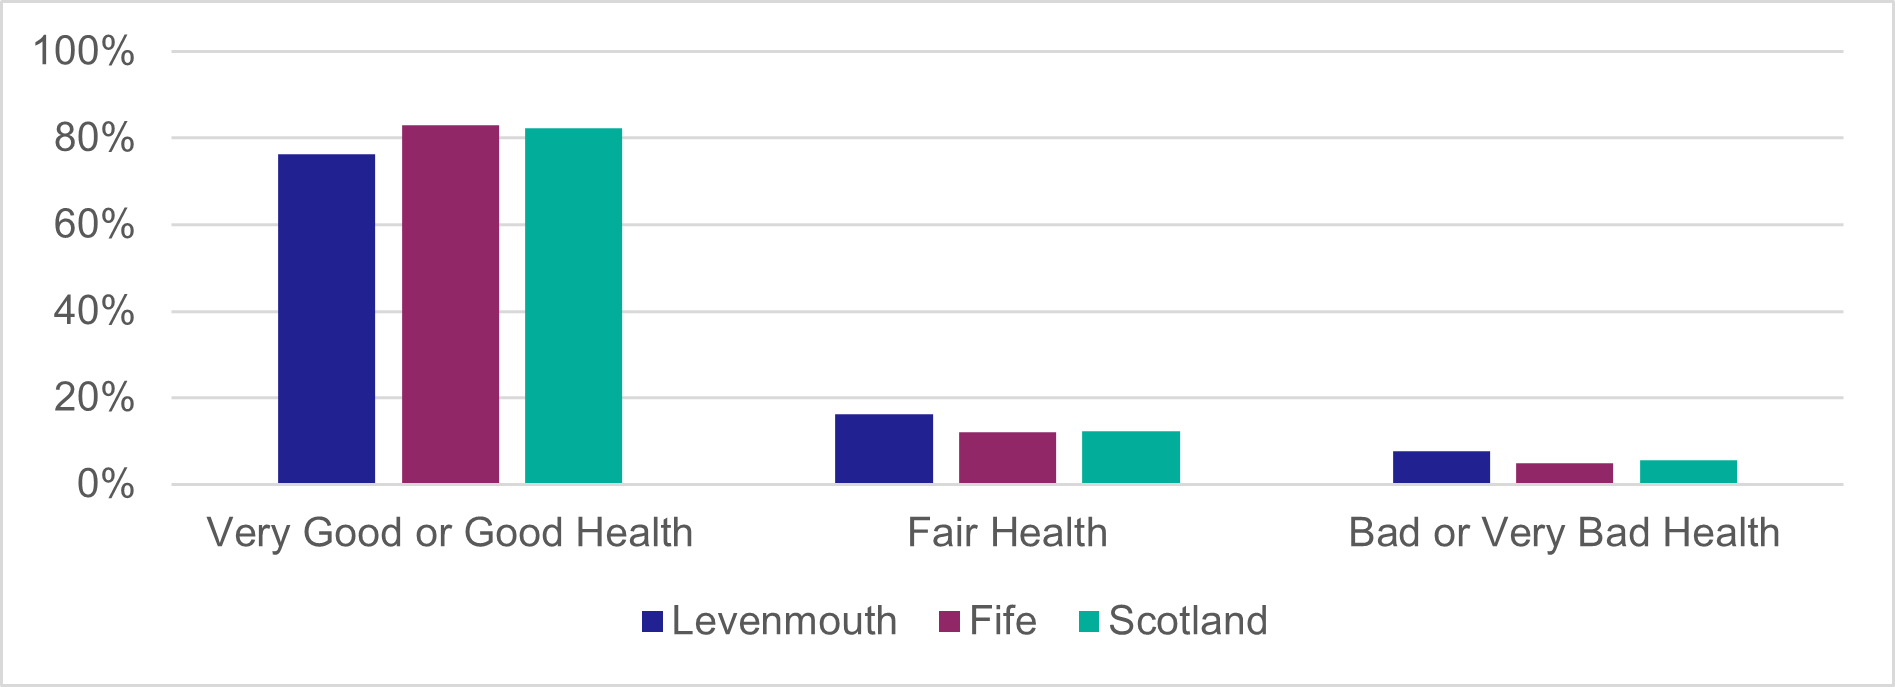
Health within Levenmouth is poor relative to Fife and the rest of Scotland, as shown in Chart 3‑3 from the 2011 Scotland Census. Levenmouth has the lowest proportion of people who consider themselves to be in ‘very good or good general health’, with 76% of the population, compared with 86% and 82% of the population in Fife and Scotland. Consequently, Levenmouth has a high proportion of the population who consider themselves to be in ‘bad or very bad general health’ with 8%, compared with Fife and Scotland (5% and 6%, respectively).
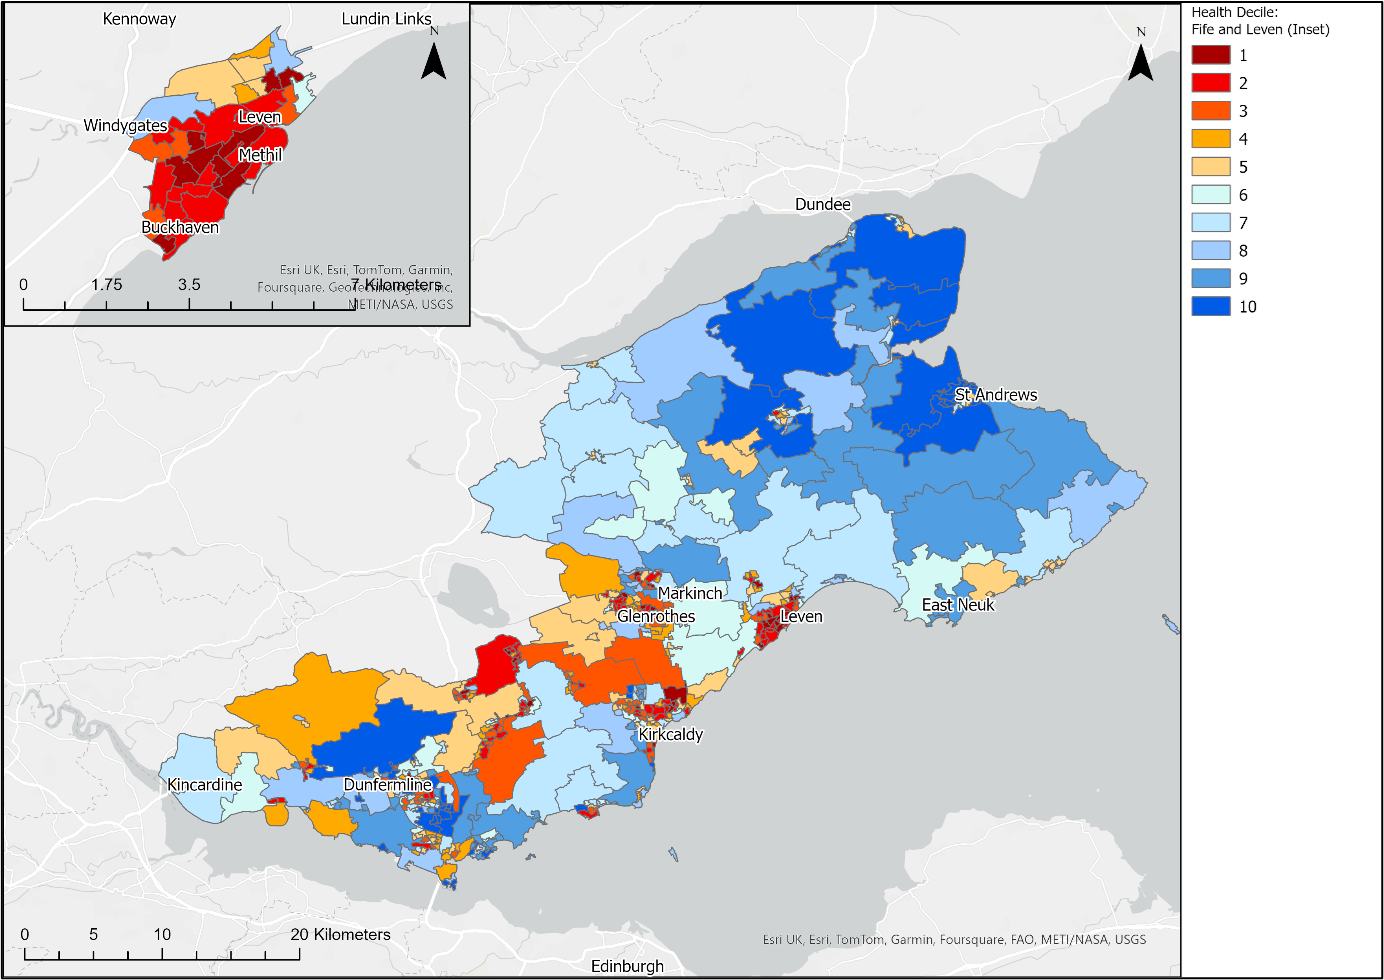
This is further demonstrated through the SIMD health domain, where 46% of the population within Levenmouth are living in the 20% most health deprived areas of Scotland, compared to 17% of the Fife population. Figure 3‑2 shows that the majority of areas within Methil and Buckhaven are considered to be health deprived compared to the rest of Scotland.
Education
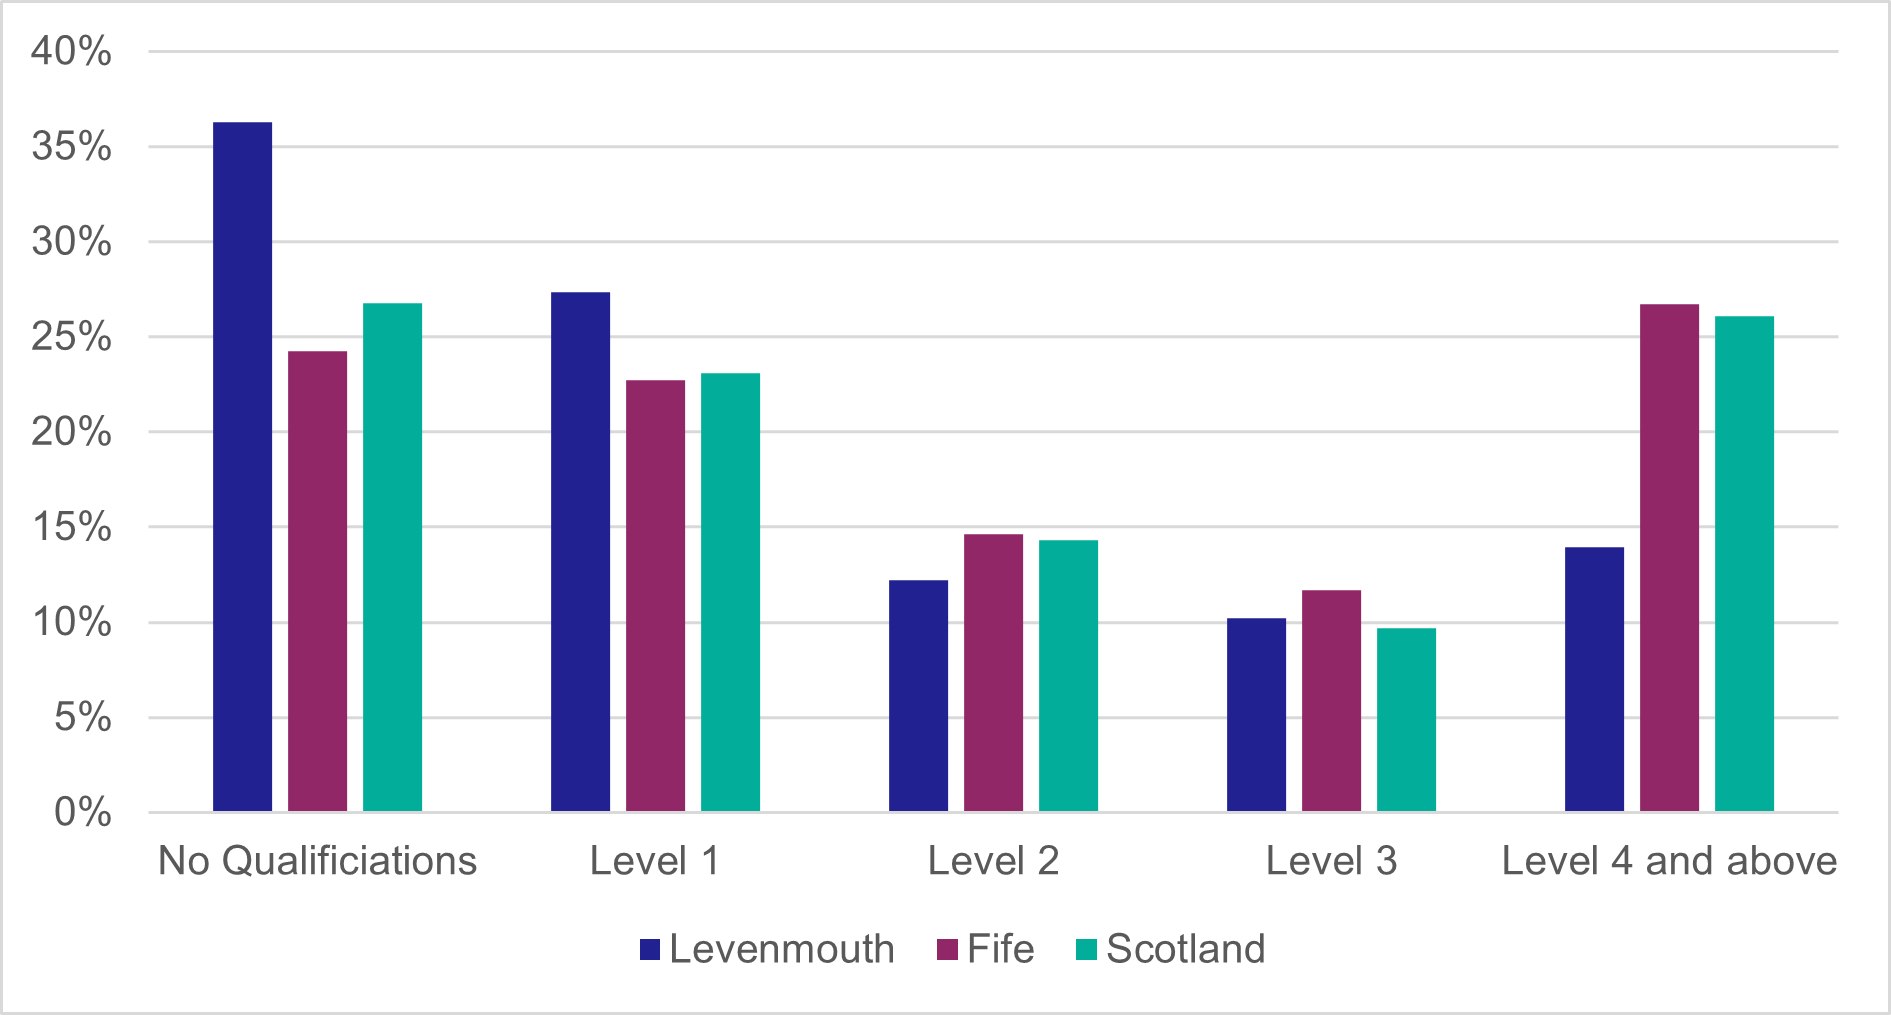
Levenmouth is shown to have lower educational attainment levels compared to both Fife and Scotland as a whole, as shown in Chart 3‑4. This is particularly evident in the percentage of the population that have no qualifications, which is reported as 36% in Levenmouth in the 2011 Scotland Census. This is considerably higher than in Fife (24%) and Scotland (27%) respectively.
Summary of each qualification definition is provided below:
- Level 1: O Grade, Standard Grade or equivalent
- Level 2: SCE Higher Grade or equivalent
- Level 3: HNC, HND or equivalent
- Level 4: Degree or Postgraduate qualifications
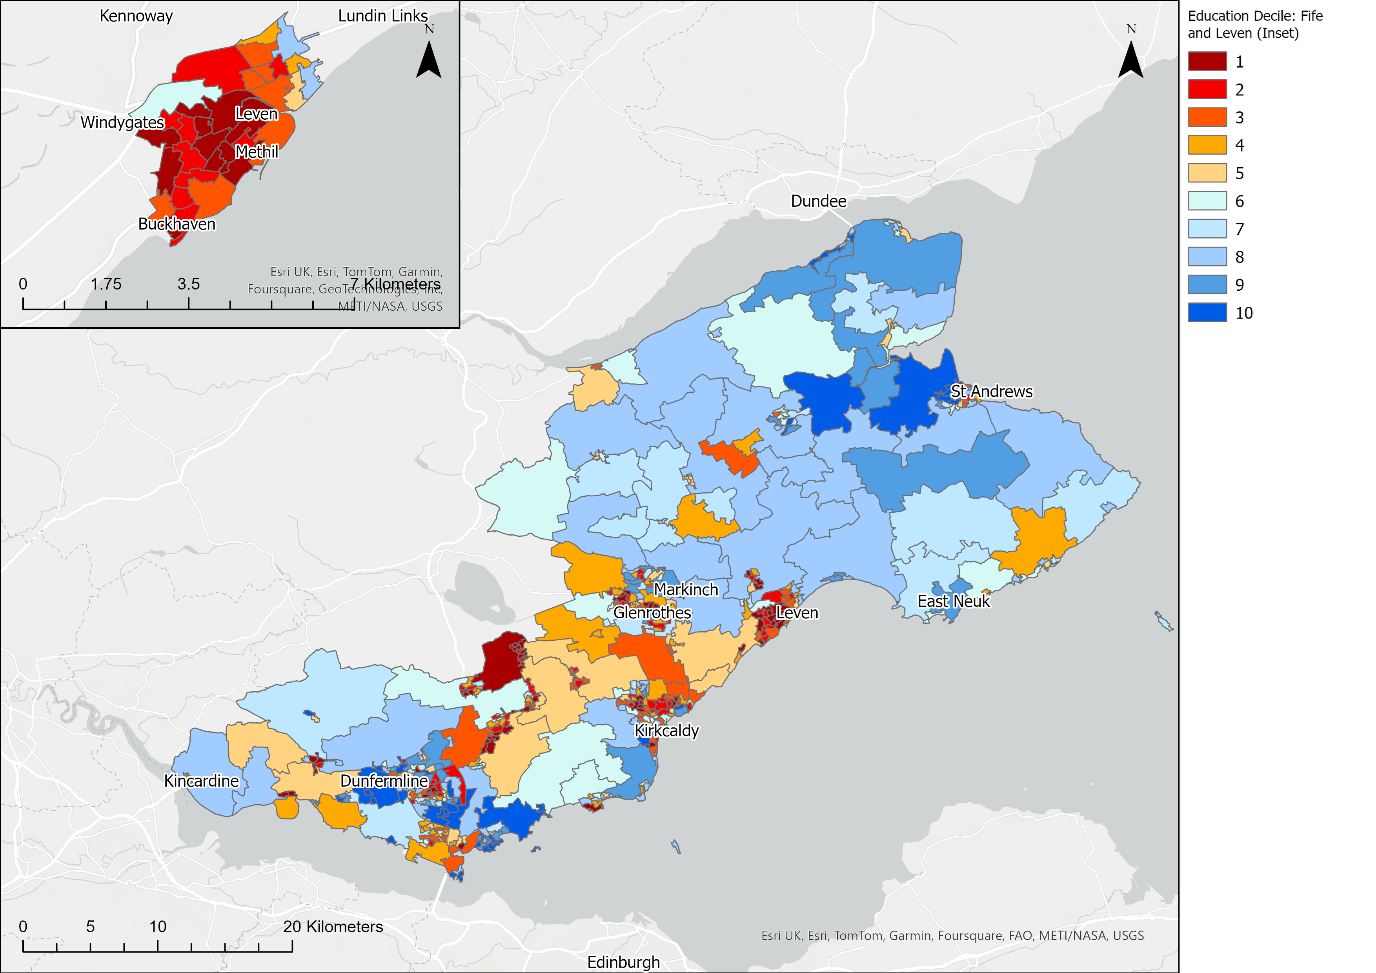
According to SIMD, Levenmouth shows high levels of educational deprivation, with 51% of population within the settlement area found in the 20% most deprived nationally, and particularly when compared to Fife where 21% of the population are identified as living in areas with high levels of deprivation on the education domain. Note that the SIMD education domain not only takes into account school attainment but also school pupil attendance, young people enrolling into higher education, young people not accessing positive destinations leaving school, and working age with no qualifications.
As shown by Figure 3‑3, most of Levenmouth shows high levels of deprivation on the education domain, particularly in the south within Methil and Buckhaven, and also areas of Leven.