Primary data collection
Introduction
Primary data collection was undertaken in the form of travel demand and patterns surveys which were designed to ask about behaviours and attitudes towards rail travel and other travel modes in the Levenmouth area.
Residents, businesses and organisations were invited to participate in the surveys to understand their baseline travel behaviour, attitudes, purposes and intentions. Participation was undertaken through door-to-door visits, telephone interviews and online surveys.
Residents’ survey
Introduction
A survey was undertaken with residents in selected locations of Fife to understand existing travel behaviour and attitudes to, as well as intentions in light of, the reinstatement of the Levenmouth Rail Link.
The target population (i.e. the collection of people from which this study intends to draw conclusions from) was set out in a sample framework. The sample framework (a means to define eligible members of a population to survey) was structured to reflect proximity to the Levenmouth Rail Link, travel to work patterns and demographic data. The target sample size of 400 survey responses provided a margin of error of around 5%.
The survey was conducted by means of face-to-face household interviewing, with fieldwork being conducted between 10th May and 23rd May 2024. A total of 432 responses were secured.
The full survey questionnaire is available as a supporting document to the main report.
Sample selection
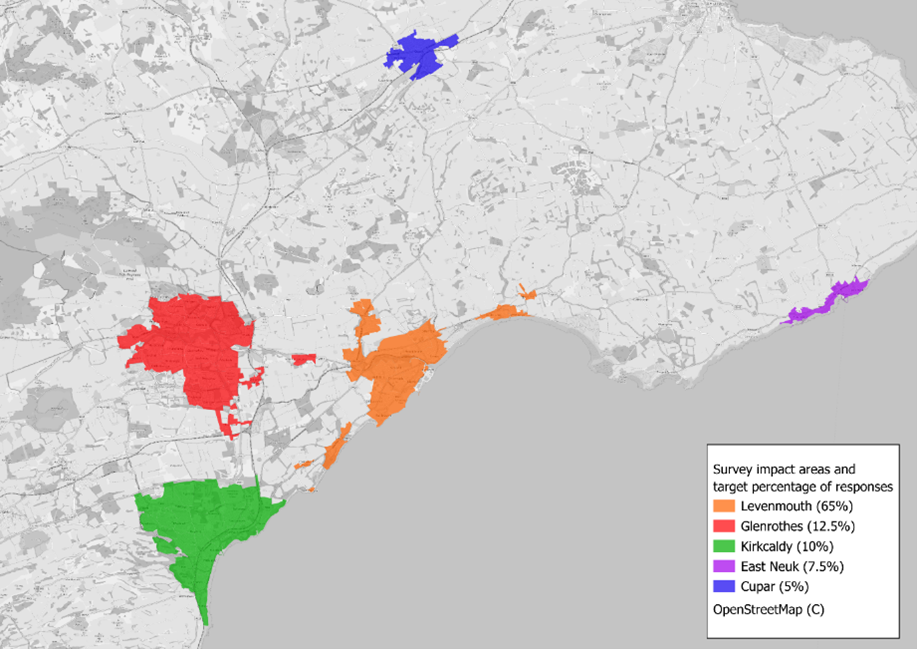
To inform the selection of households to survey, and ensure respondents were representative of the community profile, spatial analysis was conducted to determine the likely impact area for the Levenmouth Rail Link and the distribution of houses within that area. In addition, a Community Insight Profile was generated to ensure the overall profile of respondents was reflective of the demographic and socio-economic make-up of the Levenmouth community.
The Community Insights Profile is a collection of local population level demographic, social, economic and health statistics and indicators. These were collected for the Levenmouth area and drew from established data sources including; Office of National Statistics, Scotland Census 2011, and Department for Work and Pensions.
Figure 2-1 below shows the locations of the anticipated impact areas. The full methodology is provided in Appendix B in the accompanying technical appendices.
Respondent profile
The total sample size is 432 with a margin of error of +/- 4.77% for the Levenmouth area population (around 36,000) is considered indicative and is within acceptable limits. This margin of error suggests that the results of the survey can be expected to reflect the true population values within this 4.77% range above or below the results, 95% of the time.
Table 2-1 below shows the list of impact areas with the target and actual percentage of household responses for each.
| Impact Area | Target (%) | Actual (%) | Actual (No) |
|---|---|---|---|
| Leven | 16% | 18.3% | 79 |
| Methil | 19% | 16.0% | 69 |
| Buckhaven | 9% | 8.1% | 35 |
| Kennoway | 8% | 7.2% | 31 |
| Levenmouth Area Committee (including Windygates, East Wemyss, West Wemyss, Coaltown of Wemyss, Lower Largo, Upper Largo, Lunin Links) | 12% | 13.2% | 57 |
| Total Levenmouth | 64% | 62.7% | 271 |
| East Neuk (Anstruther and Pittenweem) | 8% | 6.9% | 30 |
| Glenrothes, Markinch and Thornton | 13% | 16.0% | 69 |
| Kirkcaldy | 10% | 9.5% | 41 |
| Cupar | 5% | 4.9% | 21 |
| Response number (n) | 400 | 432 | 432 |
Based on a Community Insights Profile produced for the Levenmouth area, target quotas were calculated based on age categories of 16-34, 35-64 and 65+. The achieved profiles compared to target are shown in Table 2‑2. This shows a slight over-representation of the 35-64 age group and a slight under representation of the other groups.
| Broad Age Band | Target (%) | Actual (%) |
|---|---|---|
| 16-34 | 27% | 26% |
| 35-64 | 47% | 52% |
| 65+ | 26% | 22% |
| Response number (n) | 400 | 432 |
The Community Insights Profile for the Levenmouth area showed a gender profile of 48% male and 52% female. The achieved interview profile varied from this slightly being 51% male and 48% female (the numbers do not sum to 100% due to rounding).
A target of 65% was set for respondents to be economically active, this includes the categories of working full-time, working part-time and self-employed (all other working status categories thus being defined as economically inactive). The achieved figure for the proportion of the sample that were economically active was 66%, which matches closely the target set.
Across each of these elements, any variation against initial target quotas is modest and not of a level to have any material impact on overall results. This profile will, however, have to be borne in mind when comparing results of any future survey against the baseline described herein, in order to ensure that any changes cannot be ascribed to differences in the structure of the sample.
Appendix B in the accompanying technical appendices includes a detailed set of tables according to key respondent characteristics.
Business and organisation survey
Introduction
A survey was undertaken with businesses and organisations in Levenmouth, to better understand the potential business benefits and impacts of the Levenmouth Rail Link. Organisations included public sector (education, healthcare, local government) and third sector (charities, housing associations, community and voluntary organisations).
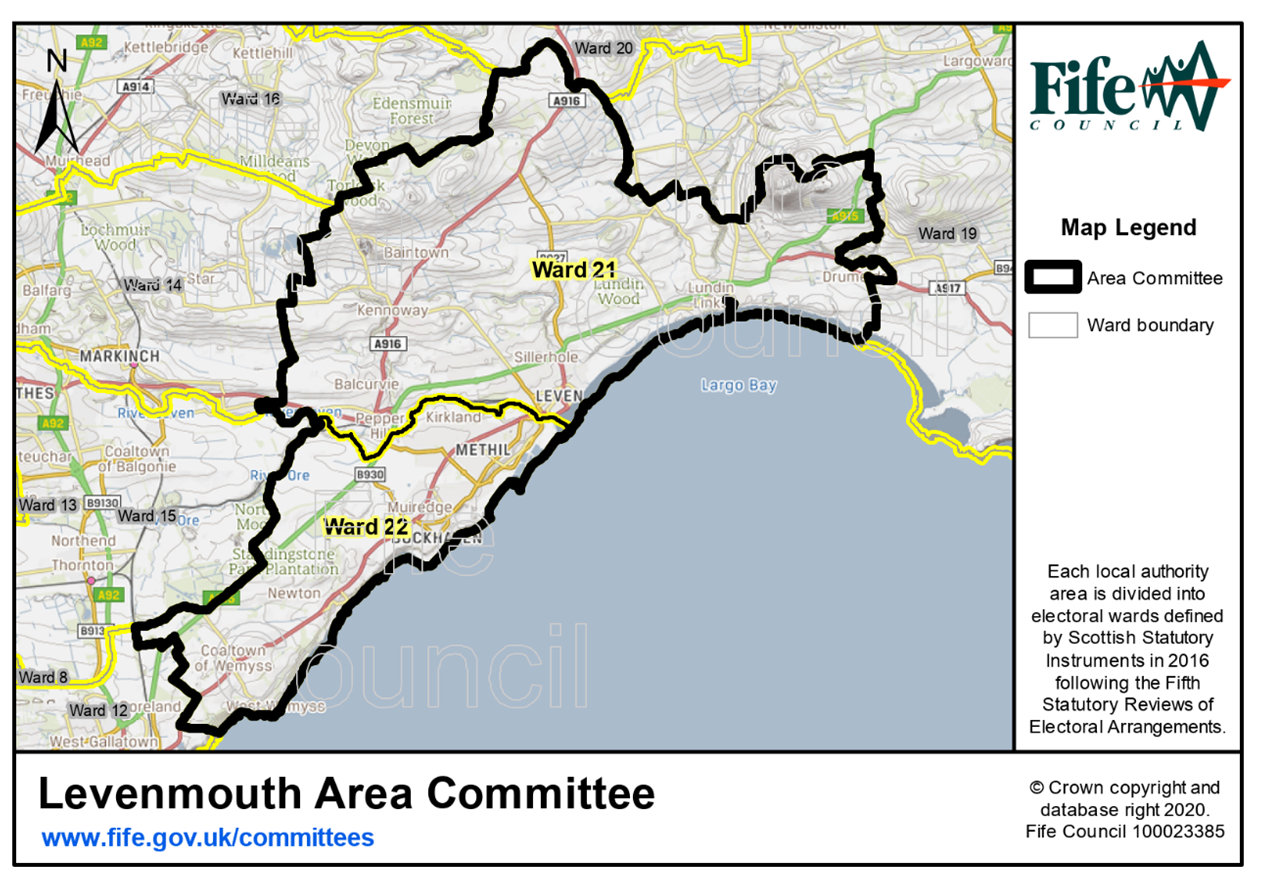
The sample frame for the survey was comprised from a combination of a bought-in, General Data Protection Regulation (GDPR) compliant database of 654 business contacts within the Levenmouth Area Committee boundary (Electoral Wards 21 and 22) (as shown in Figure 2‑2 below) and an additional set of 113 contacts in those postcodes identified from a comprehensive web search.
Surveys were conducted using online and telephone methods. Separate survey “routes” were prepared for each of private, public and third sector respondents.
A hybrid approach to the survey was adopted that involved a mix of online and telephone data collection. There were three elements to this:
- IBP issued an online survey invite and programme of reminders to 188 business and organisation contacts within the Levenmouth Area Committee where email details were available – 34 responses were secured through this route (18% response rate).
- The online survey was networked by Jacobs through partners with a potential interest in the survey – 14 responses were received through this route, of which: seven responses were secured from networking of the survey via Welcome to Fife, four via Fife Council, one via Business Gateway Fife. In two cases, the source of the response could not be identified.
- IBP’s telephone interviewers undertook a programme of telephone interviewing using the contacts sourced from the bought-in database and additional data mining – 100 interviews were achieved.
No quotas were set for this data gathering with the general aim being to secure as broad a range of responses from businesses and organisations as possible. Fieldwork dates were from 30th April to 21st May 2024.
Sample selection
In contrast to the resident survey, the business and organisation survey catchment focussed solely on the Levenmouth area itself – utilising the Levenmouth Area Committee boundary (as defined by Fife Council) as shown in Figure 2‑2. The purpose of this was to isolate as much as possible the potential benefits and impacts of the Rail Link to local businesses and organisations only. This maps closely to the KY8 and KY9 postcode areas and all responses were from within these areas. The purpose of this was to understand potential benefits and impacts of the Levenmouth Rail Link from this area only.
Respondent profile
A total of 148 responses were secured, of which 48 were online and 100 by telephone. Of these, 124 were from private sector organisations, nine from public sector organisations and 15 from third sector (charities) organisations.
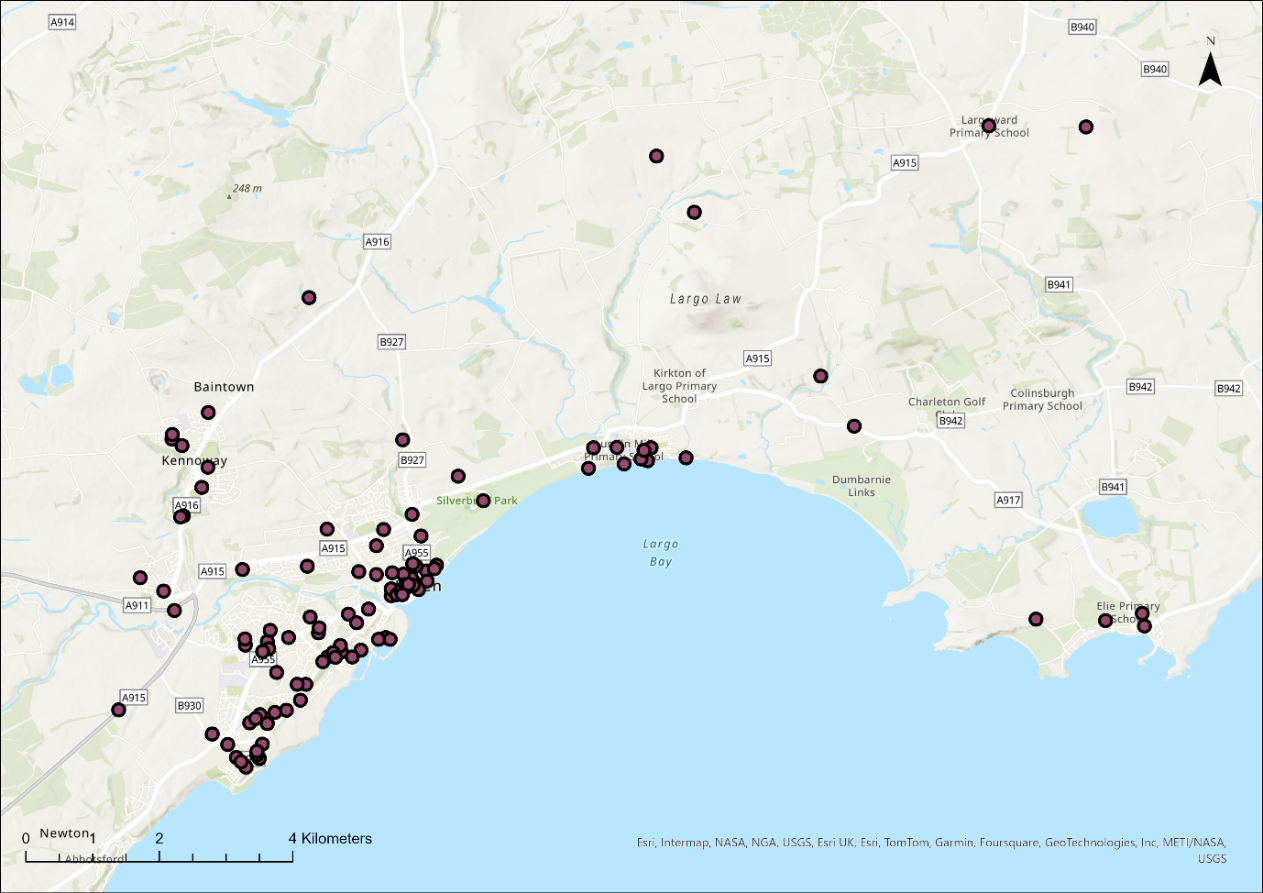
Respondents were asked to provide the postcode for their Levenmouth site. Figure 2‑3 shows a map of Levenmouth site locations.
Private Sector
A total of 124 survey respondents identified their organisation as being from the private sector.
Respondents were asked firstly how many people their business employed in total. The majority of private sector respondents were small businesses with between one and nine employees (70% of these businesses), although 17% had between ten and 49 employees and 4% had between 50 and 249 employees. Up to 9% of respondents indicated that they had 250 or more employees.
Respondents were asked how many people their business employed in Levenmouth specifically. Up to 78% of private sector respondents indicated that they employed between one and nine people in Levenmouth, with 18% indicating that they employed between ten and 49 employees and 4% between 50 and 249 employees. No respondents had 250 or more employees in the Levenmouth area specifically, suggesting that a number of local operations were branches of larger businesses.
This profile is reflected in the total number of business/organisation sites (not only in Levenmouth) reported by respondents with 78% indicating that they had a single site but 6% that they had two sites, 4% that they had three sites, 3% that they had between four and ten sites and 10% that they had 11 or more sites in total.
In terms of private sector respondents, 82% indicated that Levenmouth was the principal location for their business. The principal location for the remaining small number of other businesses were indicated as being spread across Fife, Edinburgh, elsewhere in Scotland and elsewhere in the UK.
Table 2‑3 profiles the primary activities of respondent businesses, arranged in descending order of prevalence using Standard Industrial Classification of economic activities. Note - multiple responses were allowed for this question and so responses sum to greater than 100%. Amongst private sector respondents specifically, the three common sectors represented were wholesale and retail trade including repair of motor vehicles and motorcycles (35%), accommodation and food service activities (17%) and arts, entertainment and recreation (10%).
| Sector | Percentage |
|---|---|
| Wholesale and retail trade; repair of motor vehicles and motorcycles | 35% |
| Accommodation and food service activities | 17% |
| Arts, entertainment and recreation | 10% |
| Manufacturing | 8% |
| Human health and social work activities | 7% |
| Construction | 6% |
| Professional, scientific and technical activities | 5% |
| Real estate activities | 4% |
| Agriculture, forestry and fishing | 2% |
| Transportation and storage | 2% |
| Water supply and waste management | 1% |
| Education | 1% |
| Other | 8% |
Private sector businesses were asked to provide an annual turnover for their business site in the last financial year. Only a minority of respondents were able or willing to do so and showed a very broad spread of turnover levels, with 29% of businesses having a turnover between £50,000 to £100,000, and 6% having over £5,000,000 in turnover.
Public sector
A total of nine survey respondents identified their organisation as being from the public sector.
These respondents were asked about their number of employees in Levenmouth specifically, whereby one organisation had between one and nine employees in Levenmouth, seven organisations had between 10 and 49 employees and one organisation had between 50 and 249 employees.
Five of the organisations in this category described their primary activity as “Education”; three organisations being “Local Government” (including library, leisure and care provision) and one organisation responding “Other”.
Third sector
A total of 15 survey respondents identified their organisation as being from the third sector.
These respondents were asked only about their number of employees in Levenmouth specifically, whereby 10 had between one and nine employees in Levenmouth, and four had between 10 and 49 employees (note - one respondent did not reply to this question for their organisation).
These respondents described their organisation’s primary activities in a number of ways, with eight describing the organisation as a national charity, eight as a voluntary/community organisation, four as a social enterprise and one as an international charity (Note - one respondent did not reply to this question and multiple responses were allowed, meaning responses do not sum to the number of respondents).