Appendix B: Resident survey sample selection methodology
This Appendix describes the methodology used to define the sample selection or the residents survey. This covers:
- the impact area definition; and
- Community Profile definition.
Impact area definition
The table below provides a breakdown of the areas to be targeted for the residents’ survey, with the number of houses to obtain completed responses from.
The residents’ survey focussed on households within Levenmouth, plus settlements in the immediate surrounding area to understand the how the Levenmouth Rail Link may affect the way they travel. Those areas include villages in the East Neuk (Pittenweem and Anstruther), Upper Largo, Lower Largo, Lundin Links and the Wemyss Villages, Kirkcaldy, Glenrothes and Cupar.
A minimum sample size of 400 responses was determined as it would provide a satisfactory level of statistical confidence (95%) in the results (providing a margin of error of +/4.9% - see notes below) for the population of the Levenmouth area of 30,700 people.
Note 1 – this is based on a 50% estimate and 95% confidence level. This means that, if 50% of the sample answer a question in a given way, then we can be 95% certain that the figure for the population as a whole would be between 45.1% and 54.9% (i.e. 4.9% either way of the 50% figure).
Note 2 – a total of 432 resident surveys were completed, exceeding the 400 target. This resulted in a margin of error of +/-4.7%.
The spatial distribution of the household responses is shown in Table B-1 below and accompanying map in Figure B-1 below. A full breakdown of the target spatial distribution (at the settlement level) is provided in Table B-3. To ensure the majority of responses were received from households within Levenmouth, weightings were applied and the total number of households were based on a range of factors, including:
- National Records of Scotland (NRS) and Scotland Census 2011 to determine area population and household distribution and Travel to Work (TTW) flows.
- Journey time accessibility data.
- Information from the Levenmouth Sustainable Transport Study Case for Change.
| Location | Target (%) | Actual (%) |
|---|---|---|
| Leven | 16% | 18% |
| Methil | 19% | 16% |
| Buckhaven | 9% | 8% |
| Kennoway | 8% | 7% |
| Other Levenmouth (including Windygates, East Wemyss, West Wemyss, Coaltown of Wemyss, Lower Largo, Upper Largo, Lunin Links) | 12% | 13% |
| Total Levenmouth | 64% | 63% |
| East Neuk (Anstruther and Pittenweem) | 8% | 7% |
| Glenrothes, Markinch and Thornton | 13% | 16% |
| Kirkcaldy | 10% | 9% |
| Cupar | 5% | 5% |
| Base | 400 | 432 |
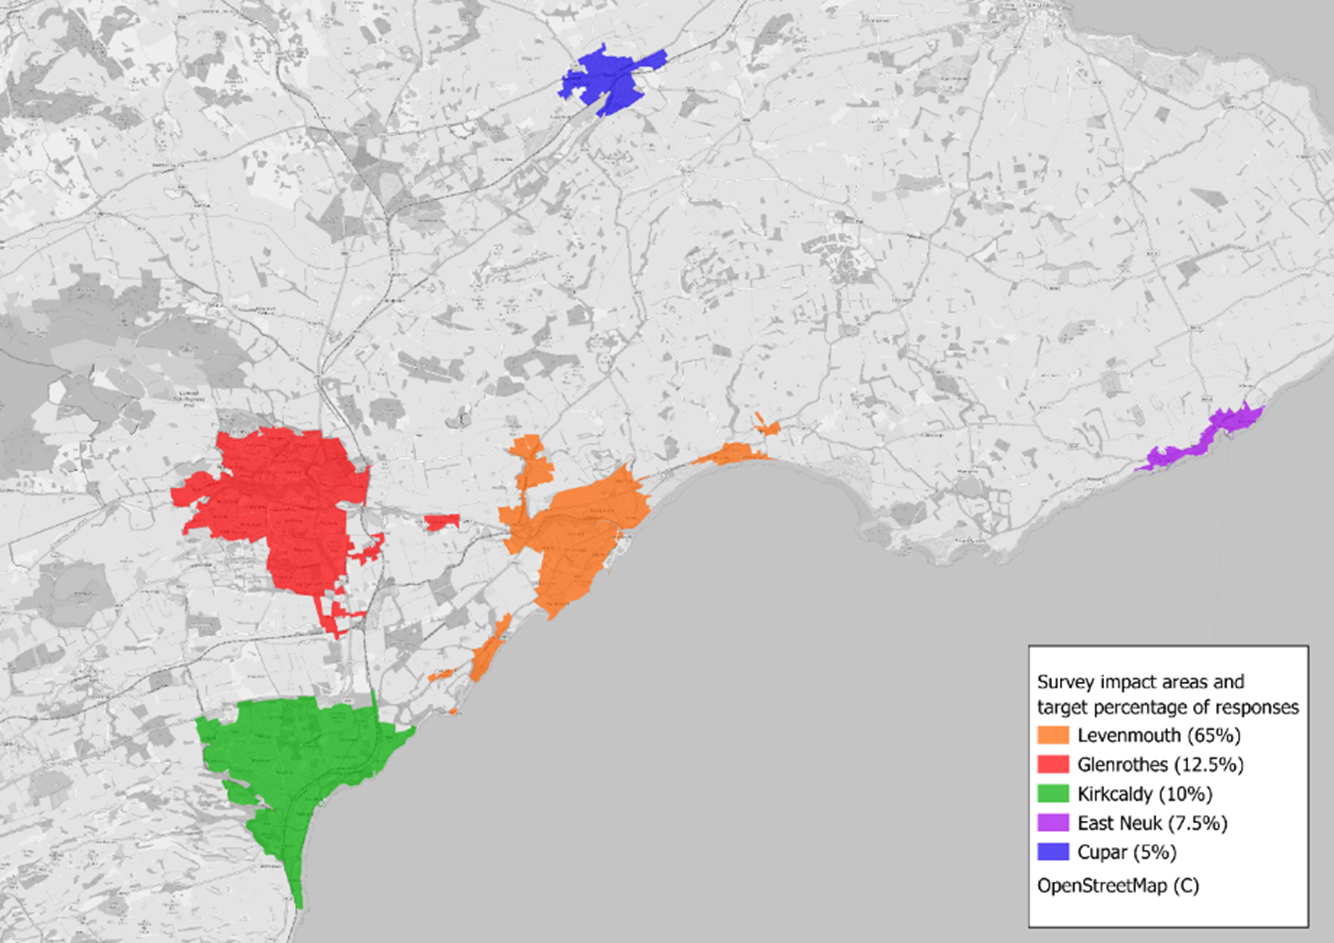
In summary:
- Levenmouth (based on Fife Council Wards 21 and 22) includes the Wemyss Villages, Lundin Links and Largo. Whilst the TTW data indicated over 70% of trips to work were undertaken internally within Levenmouth, this weighting has been reduced to 65% to ensure a statistically sufficient minimum sample size can be collected for the remaining areas.
- Glenrothes (including Thornton and Markinch) and Kirkcaldy cumulatively represent approximately two-thirds of the responses from locations outwith Levenmouth (with Glenrothes having a slightly higher proportion based on TTW data than Kirkcaldy).
- East Neuk, whilst having a smaller TTW percentage, accounts for 7.5% of the responses. This is higher than the other TTW areas due to the potential propensity to use the Rail Link from the East Neuk (due to shorter travel time to access their nearest rail station (i.e. Kirkcaldy, Markinch, Glenrothes; or stations to the North such as Ladybank).
- North Fife, the TTW data indicated some level of demand between Leven and north Fife – namely Cupar. In addition, the ScotRail’s ‘Fife and Tay Cities Timetable Consultation’ feedback indicated a small amount of demand for direct/better connections between Leven and north Fife (And beyond to Perth and Dundee). To reflect this in the survey responses, Cupar (with its own station on the East Coast Main Line) has been selected as a proxy for these areas, as most of the TTW trips from north Fife originate from here, and with being a town with a rail station commuters could make the trip between Cupar and Leven through interchange at Kirkcaldy. It is noted however:
- There is currently an hourly, direct bus service between Cupar and Leven with an approximate journey time of 35 to 40 minutes; and
- Based on the interim/draft ScotRail timetable, the journey time between Cupar and Leven rail stations would be between approximately 60 to 70 minutes, including an approximate 20 to 25 minute interchange time at Kirkcaldy.
The survey did not extend beyond these areas as the TTW data suggested there are not many locations or significant number of people beyond the areas identified making trips to work in Levenmouth, as well as the potential for double-counting responses as the business survey questions employers (in Levenmouth) where their employees are travelling from.
| Area | Town | Town/Settlement | Number of Dwellings | Number of Households to Survey | Percentage of total responses |
|---|---|---|---|---|---|
| Levenmouth | Leven | Leven East | 1,649 | 25 | 6.3% |
| Levenmouth | Leven | Leven North | 1,188 | 17 | 4.3% |
| Levenmouth | Leven | Leven West | 1,420 | 20 | 5.0% |
| Levenmouth | Methil | Methil East | 1,607 | 24 | 6.0% |
| Levenmouth | Methil | Methil Methilhill | 1,994 | 30 | 7.5% |
| Levenmouth | Methil | Methil West | 1,262 | 20 | 5.0% |
| Levenmouth | Buckhaven | Buckhaven | 2,465 | 35 | 8.8% |
| Levenmouth | Kennoway | Kennoway | 1,981 | 30 | 7.5% |
| Levenmouth | Windygates | Windygates | 795 | 11 | 2.8% |
| Levenmouth | East Wemyss | East Wemyss | 931 | 13 | 3.3% |
| Levenmouth | West Wemyss | West Wemyss | 107 | 5 | 1.3% |
| Levenmouth | Coaltown of Wemyss | Coaltown of Wemyss | 295 | 5 | 1.3% |
| Levenmouth | Largo | Lower Largo | 503 | 10 | 2.5% |
| Levenmouth | Largo | Largo | 207 | 5 | 1.3% |
| Levenmouth | Levenmouth | Lundin Links | 399 | 10 | 2.5% |
| East Neuk | Anstruther | Anstruther | 1,558 | 20 | 5.1% |
| East Neuk | Pittenweem | Pittenweem | 725 | 10 | 2.4% |
| Glenrothes, Markinch and Thornton | Glenrothes | Glenrothes Auchmuty | 1,572 | 2 | 0.5% |
| Glenrothes, Markinch and Thornton | Glenrothes | Glenrothes Balfarg Pitcairn and Coul | 1,250 | 2 | 0.5% |
| Glenrothes, Markinch and Thornton | Glenrothes | Glenrothes Balgeddie and Town Park | 1,480 | 2 | 0.5% |
| Glenrothes, Markinch and Thornton | Glenrothes | Glenrothes Cadham and Pitcoudie | 1,029 | 2 | 0.6% |
| Glenrothes, Markinch and Thornton | Glenrothes | Glenrothes Caskieberran and Rimbleton | 2,027 | 2 | 0.5% |
| Glenrothes, Markinch and Thornton | Glenrothes | Glenrothes Collydean | 1,019 | 2 | 0.6% |
| Glenrothes, Markinch and Thornton | Glenrothes | Glenrothes Macedonia and Tanshall | 1,912 | 3 | 0.8% |
| Glenrothes, Markinch and Thornton | Glenrothes | Glenrothes Pitteuchar | 2,129 | 3 | 0.8% |
| Glenrothes, Markinch and Thornton | Glenrothes | Glenrothes South Parks | 1,004 | 2 | 0.6% |
| Glenrothes, Markinch and Thornton | Glenrothes | Glenrothes Stenton and Finglassie | 1,435 | 3 | 0.8% |
| Glenrothes, Markinch and Thornton | Glenrothes | Glenrothes Woodside | 1,162 | 3 | 0.7% |
| Glenrothes, Markinch and Thornton | Glenrothes | Leslie and Newcastle | 1,873 | 3 | 0.8% |
| Glenrothes, Markinch and Thornton | Markinch | Markinch | 1,571 | 5 | 1.3% |
| Glenrothes, Markinch and Thornton | Milton of Balgonie | Milton of Balgonie | 113 | 5 | 1.3% |
| Glenrothes, Markinch and Thornton | Coaltown of Balgonie | Coaltown of Balgonie | 453 | 5 | 1.3% |
| Glenrothes, Markinch and Thornton | Thornton | Thornton | 924 | 5 | 1.3% |
| Kirkcaldy | Kirkcaldy | Dysart | 1,757 | 3 | 0.8% |
| Kirkcaldy | Kirkcaldy | Kirkcaldy Bennochy East | 1,651 | 3 | 0.7% |
| Kirkcaldy | Kirkcaldy | Kirkcaldy Bennochy West | 1,327 | 2 | 0.6% |
| Kirkcaldy | Kirkcaldy | Kirkcaldy Central | 1,678 | 3 | 0.7% |
| Kirkcaldy | Kirkcaldy | Kirkcaldy Chapel | 1,950 | 3 | 0.8% |
| Kirkcaldy | Kirkcaldy | Kirkcaldy Dunnikier | 1,398 | 2 | 0.6% |
| Kirkcaldy | Kirkcaldy | Kirkcaldy Gallatown and Sinclairtown | 2,033 | 4 | 0.9% |
| Kirkcaldy | Kirkcaldy | Kirkcaldy Hayfield and Smeaton | 1,597 | 3 | 0.7% |
| Kirkcaldy | Kirkcaldy | Kirkcaldy Linktown and Seafield | 2,041 | 4 | 0.9% |
| Kirkcaldy | Kirkcaldy | Kirkcaldy Newliston and Redcraigs | 1,430 | 2 | 0.6% |
| Kirkcaldy | Kirkcaldy | Kirkcaldy Pathead | 1,606 | 3 | 0.7% |
| Kirkcaldy | Kirkcaldy | Kirkcaldy Raith | 1,100 | 2 | 0.5% |
| Kirkcaldy | Kirkcaldy | Kirkcaldy Templehall East | 2,181 | 4 | 0.9% |
| Kirkcaldy | Kirkcaldy | Kirkcaldy Templehall West | 1,409 | 2 | 0.6% |
| Cupar | Cupar | Cupar | 4,070 | 20 | 5.0% |
Respondent characteristics
This section provides details of the respondent characteristics for the resident household survey.
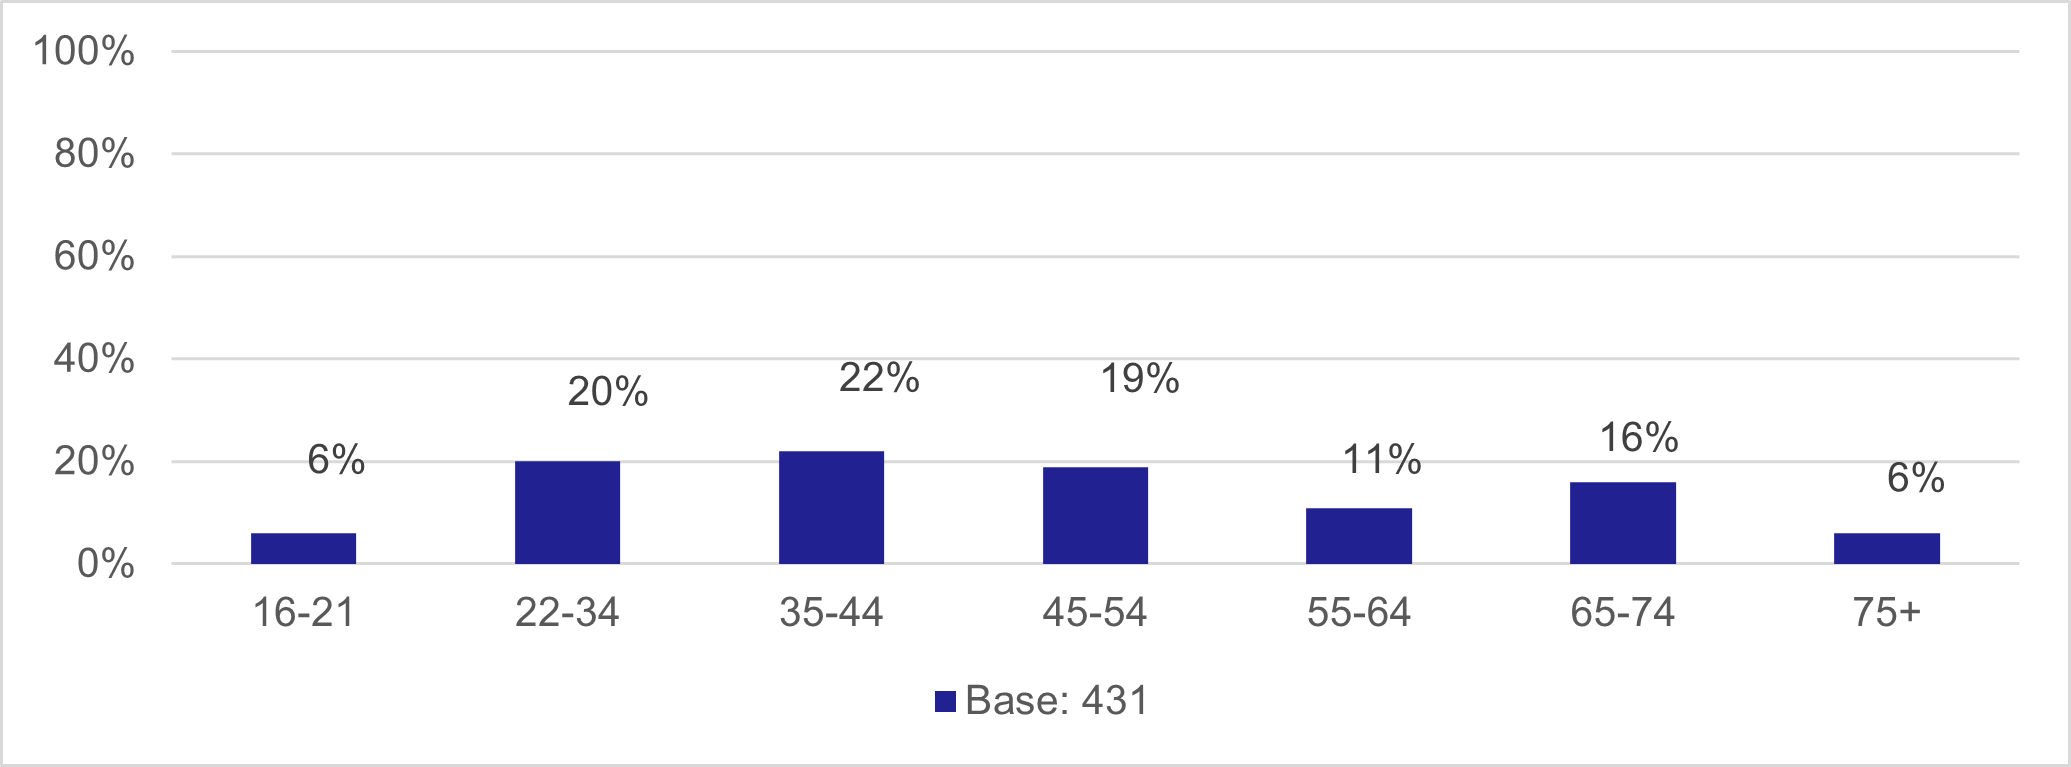
As shown in Chart B-1, the profile of respondents by age shows a wide range of age groups represented.
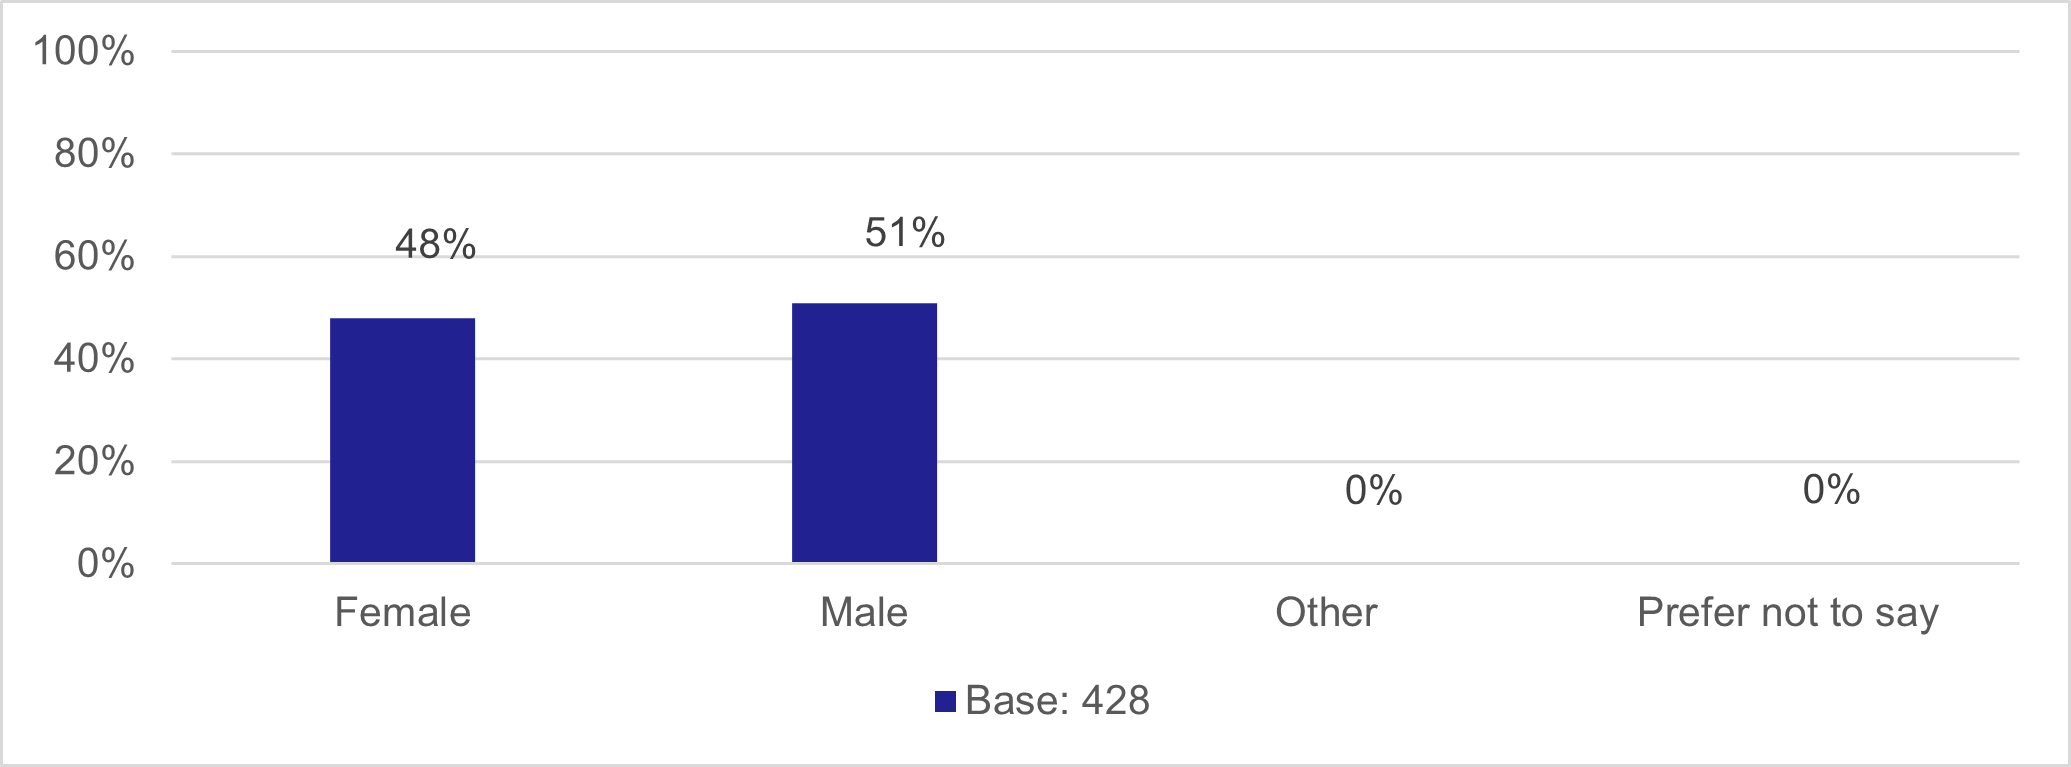
As shown in Chart B-2, there were slightly more male respondents (51%) than female respondents (48%).
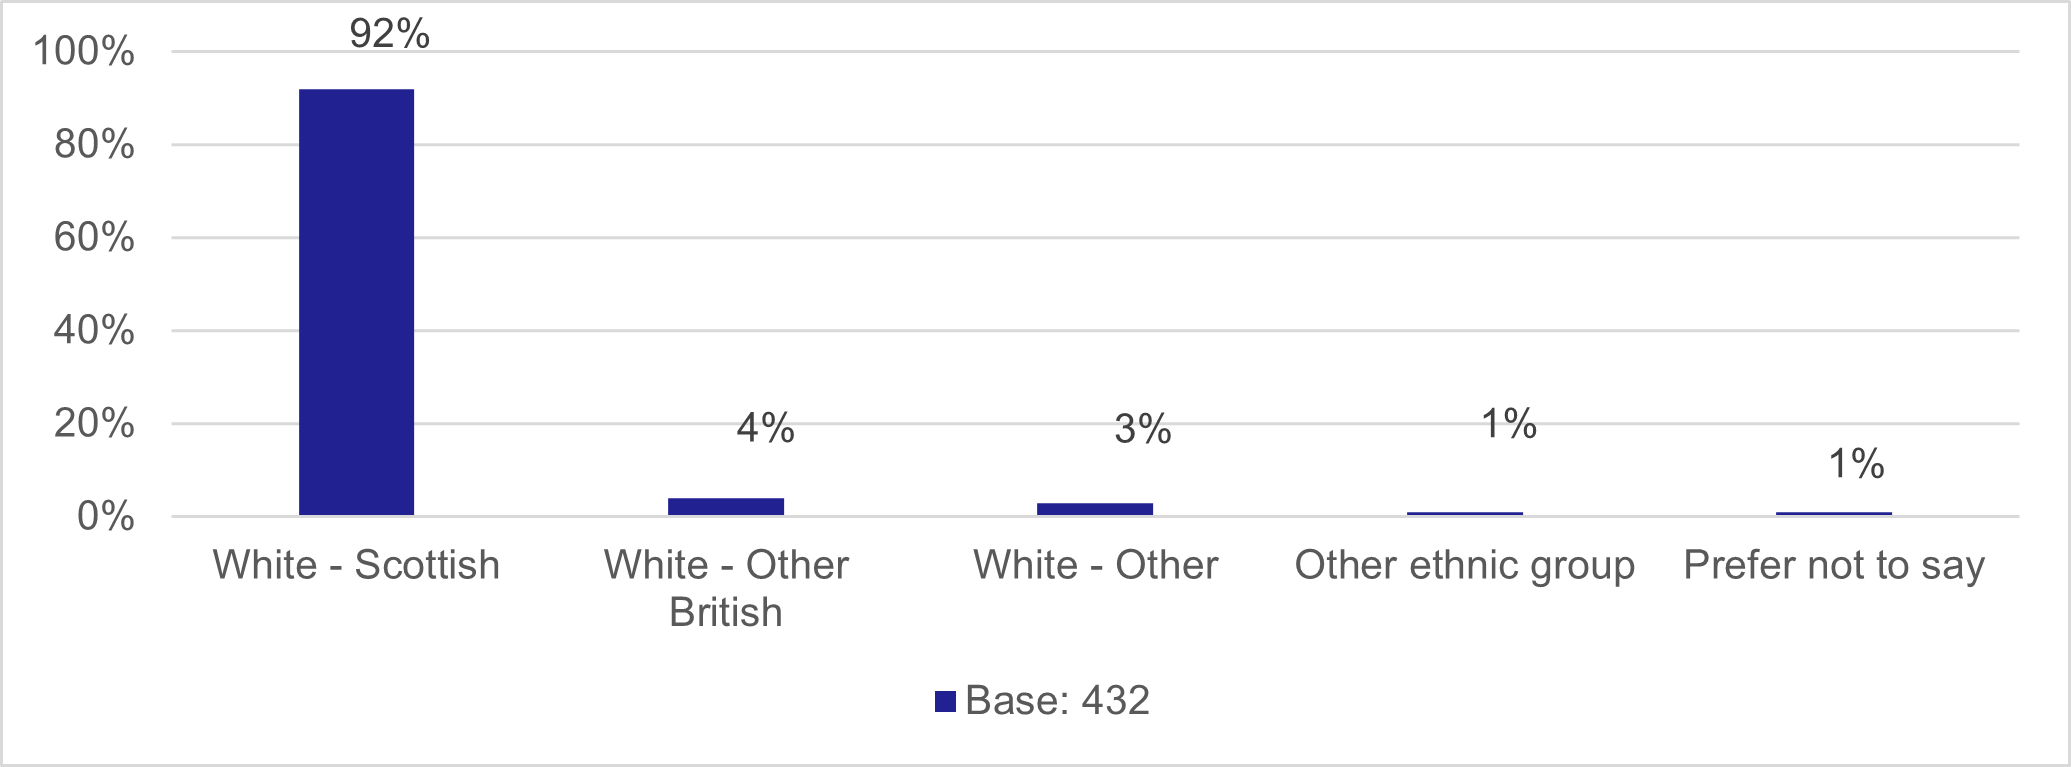
As shown in Chart B-3, 92% of respondents described their ethnic group as “White Scottish”.
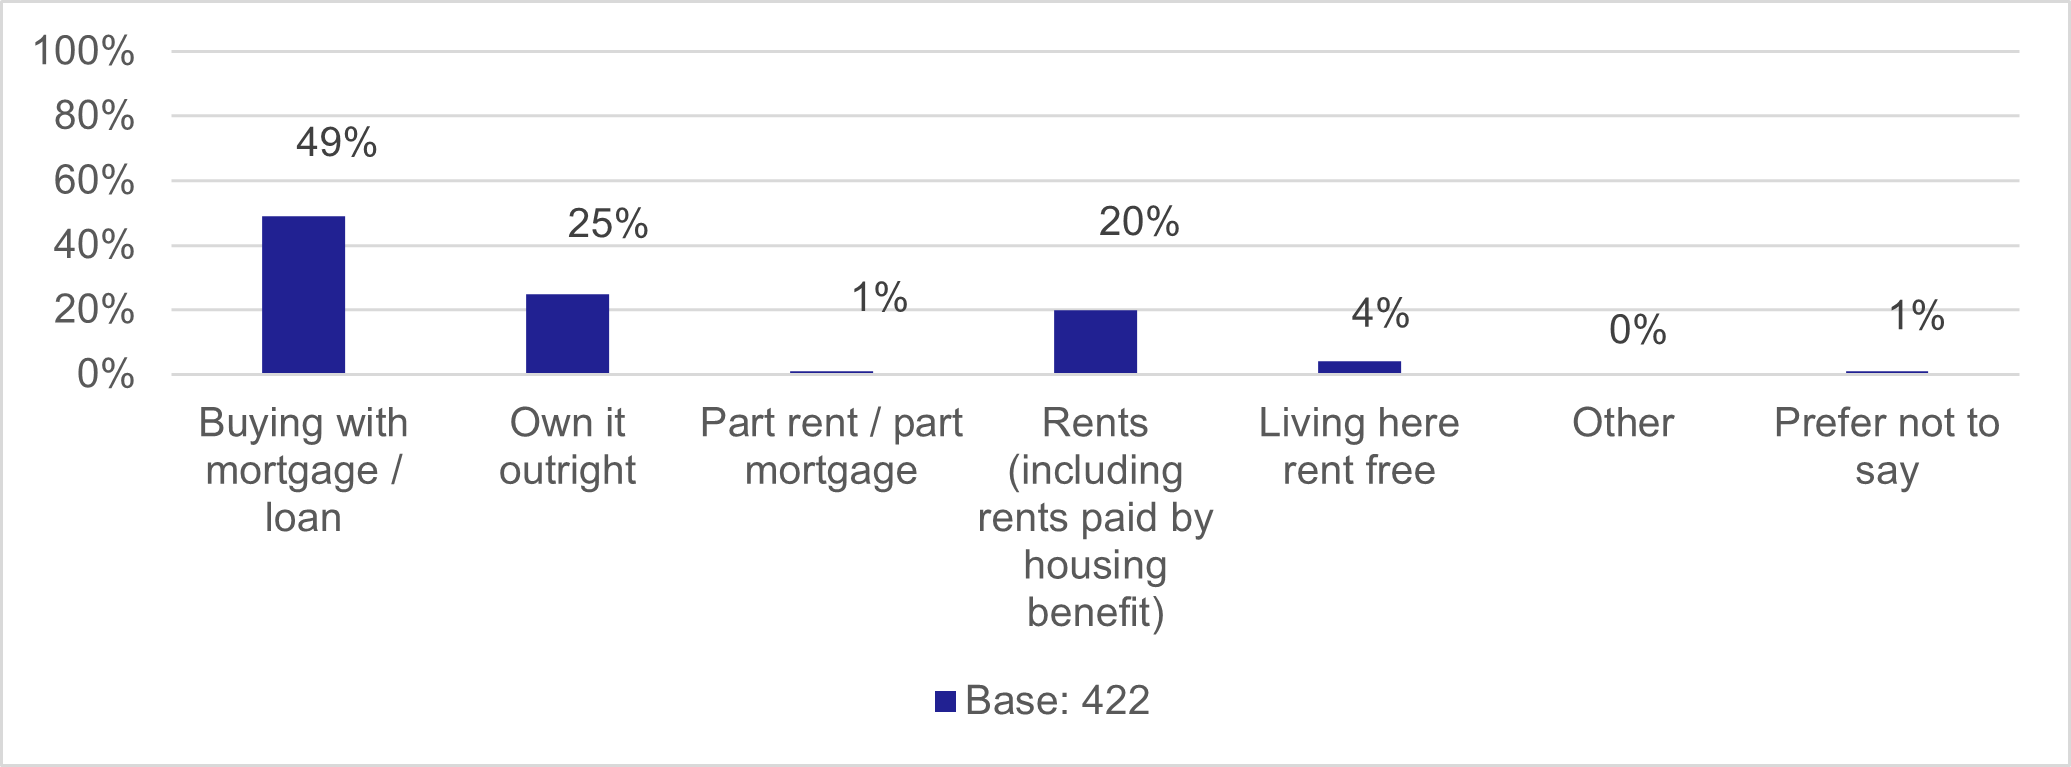
As shown in Chart B-4, the majority of respondents were homeowners (74%), while a further 20% rented their home, and 4% indicated they live rent-free.
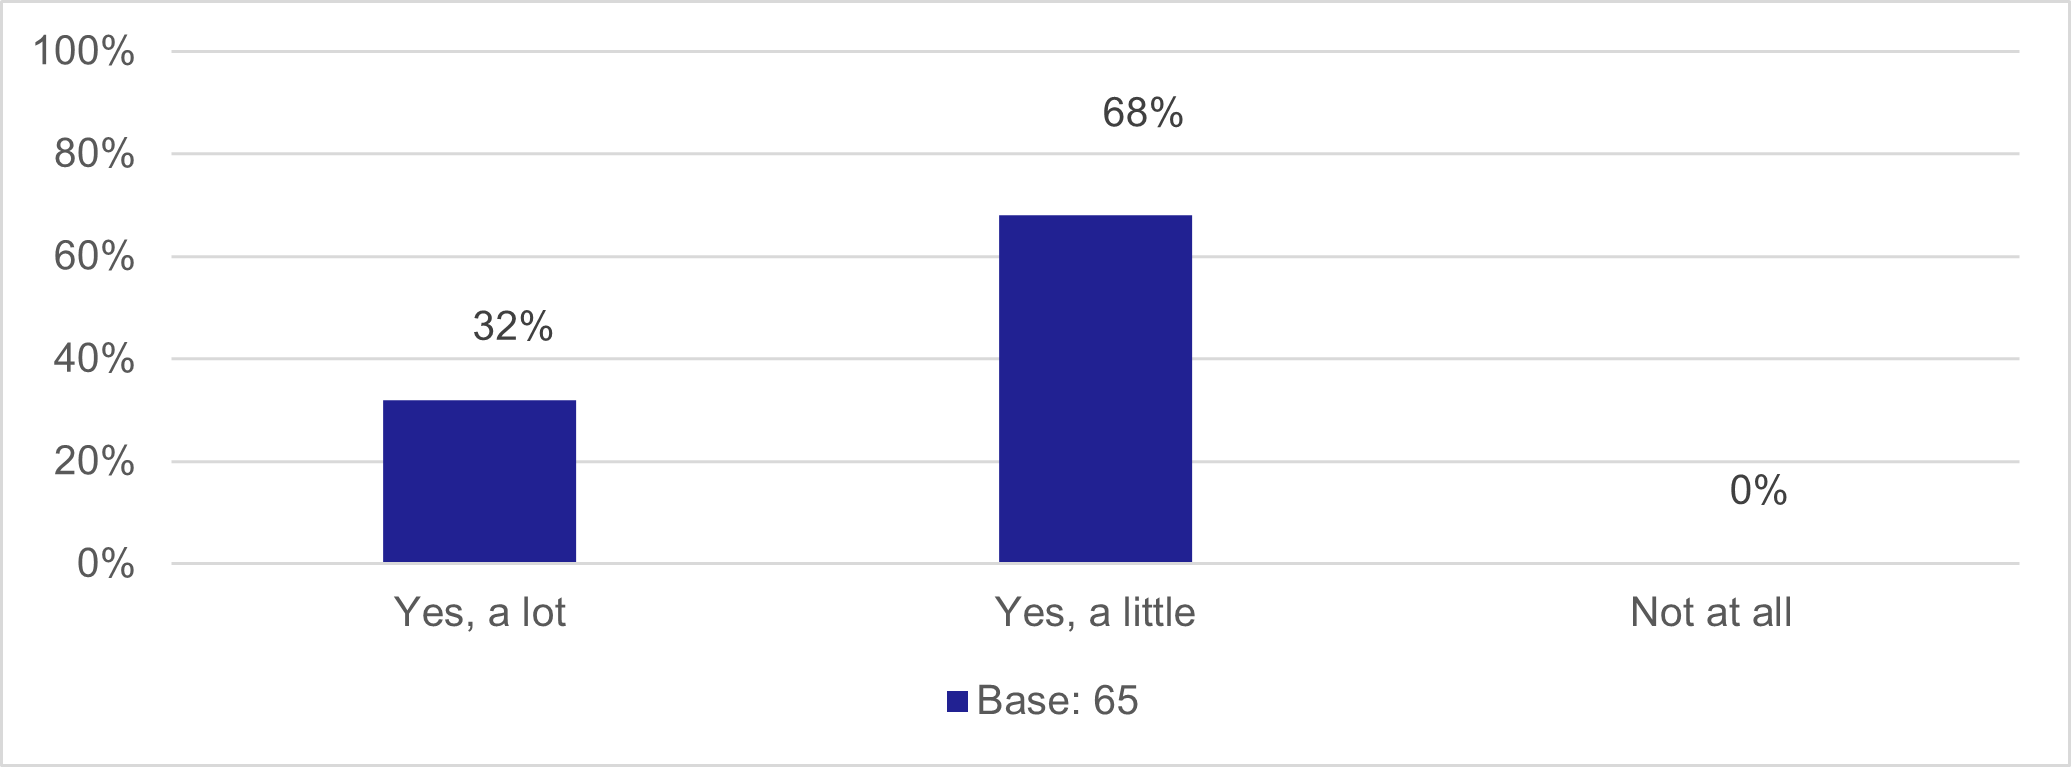
Fifteen per cent of respondents indicated that they had a physical or mental health condition or illness lasting or expected to last 12 months or more. Amongst this group, all respondents said that their condition affects their ability to carry out day-to-day activities, either a lot (32%) or a little (68%).
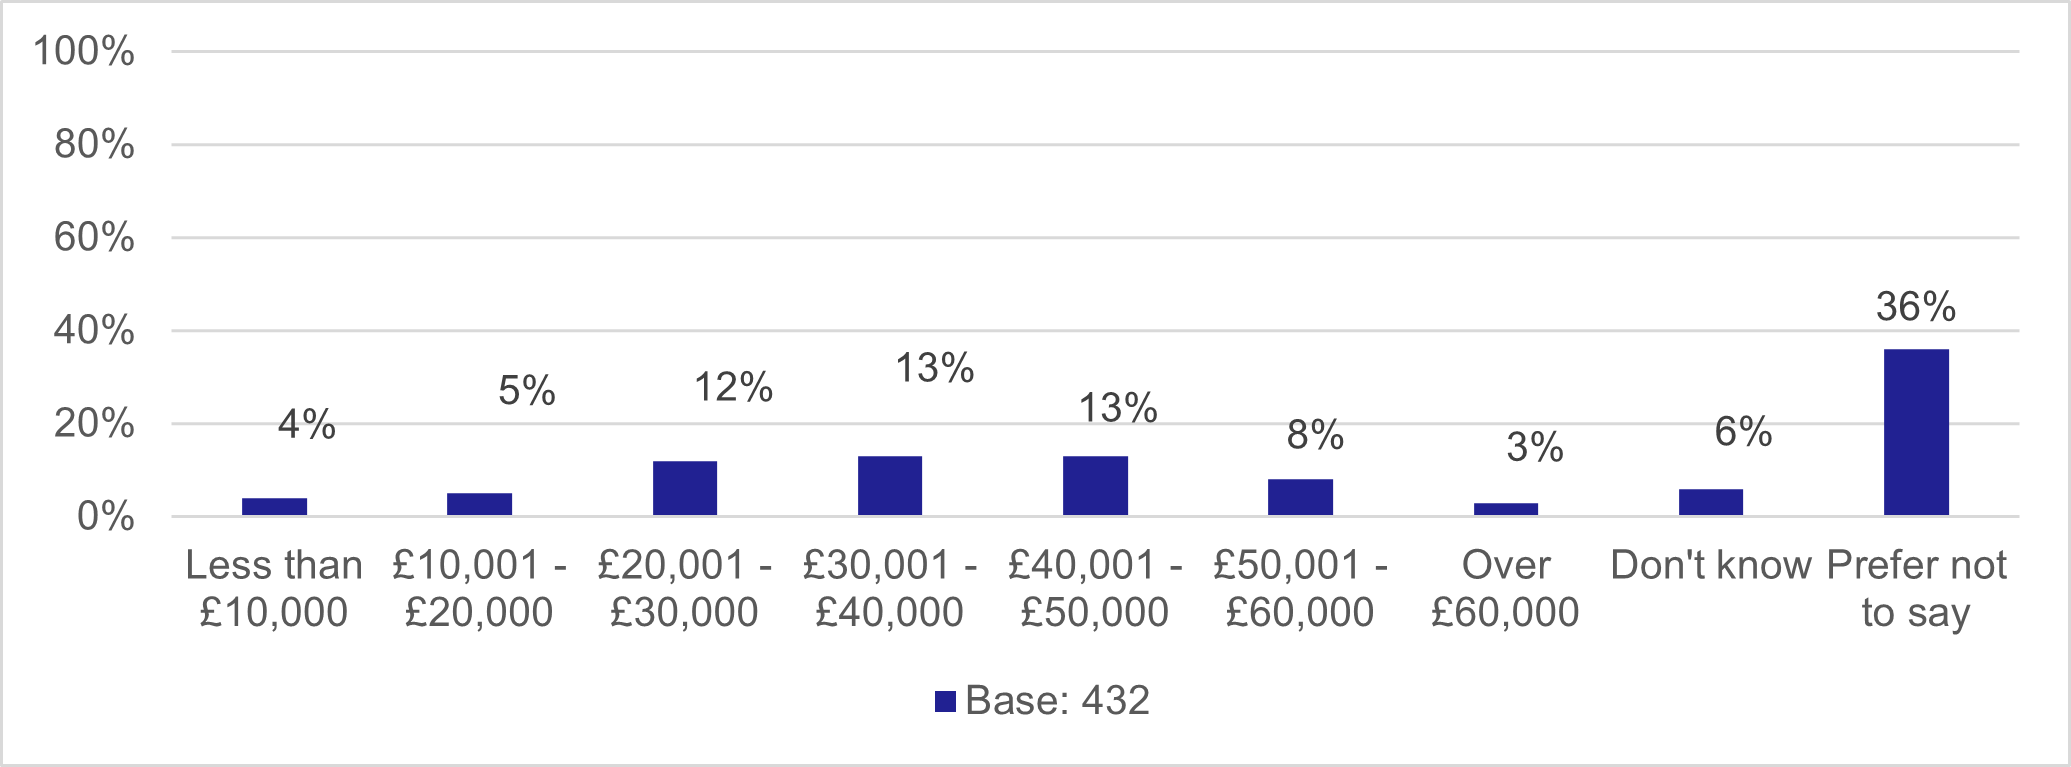
Taking the mid-point values from the income bands as shown in Chart B-6 below, the average gross annual income amongst respondents (before tax and other deductions and including all income from employment, benefits, pensions and savings) is calculated to be £35,295 (assuming “Less than £10,000” as £5,000 and “Over £60,000” as £60,000). This is based only on those that provided an answer to this question and “over £60,000” responses are assumed at £60,000, which likely means that this figure is a slight underestimate.
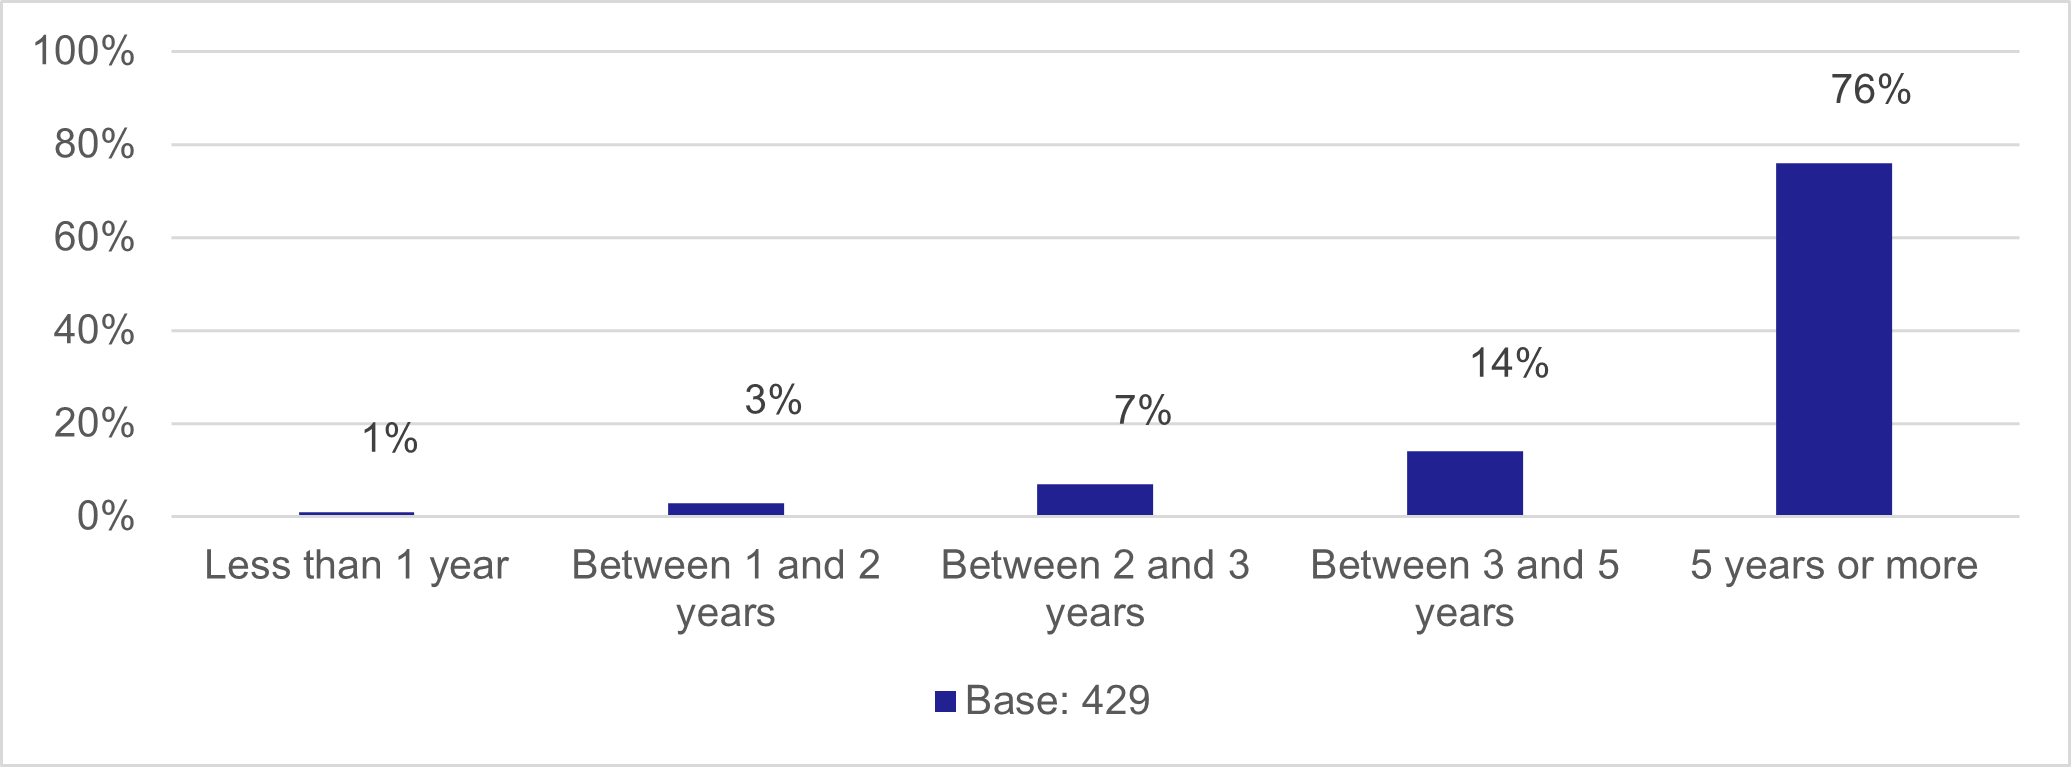
As shown in Chart B-7, the majority of respondents had lived at their current address for five years or more (76%).
From home postcodes provided, the following profile of respondents has been derived. Most commonly, respondents were from Leven (18%), followed by Methil (16%), Glenrothes, Markinch and Thornton (16%) and other Levenmouth areas (13%). As noted in the previous section, this profile broadly reflects the target quotas that were set for the interviewing process.
The profile of residents by employment status is detailed in Table B-3 and shows that the majority of respondents were employed or self-employed (66%) while almost a quarter were retired (23%).
| Employment Status | Percentage |
|---|---|
| Employed full-time | 51% |
| Employed part-time (fewer than 30 hours per week) | 11% |
| Self employed | 4% |
| Not in employment - looking for work | 4% |
| Not in employment - not looking for work | 5% |
| Retired | 23% |
| Student | 1% |
| Other | 1% |
| Base | 431 |