Assessing the scale of the problem
Information for the study was collected in two ways. The primary source of information was Transport Scotland’s Integrated Road Information System (IRIS). In addition, direct requests for information were made to OC representatives for information relating to early life pavement failures. The two data collection approaches and findings are described below.
IRIS
Data on the condition of trunk roads is routinely collected by OCs to ensure that they are safe, efficient and well managed. This information is uploaded to IRIS, which contains several parts. The first step in the data gathering process involved interrogating the Operating Company Pavement Management System (OCPMS) section to extract construction records and scheme extents of all structural maintenance schemes (0100 code). A selected time period of five years was targeted, i.e. January 2015 to December 2019. From this dataset, the scheme extents were cross referenced with post construction defect records held within the Routine Maintenance section of IRIS.
The Routine Maintenance Management function (RMMf) contains information on surface defects that are collected as part of regular inspections and patrols of the trunk road network. It typically covers areas of activity in which work is generally short term and necessary to keep the road network in good working order. Schemes that exhibited insignificant numbers of defects were removed from the analysis at an early stage. This was done to ensure that the search focussed on schemes that contained clusters of defects as opposed to the odd isolated defect.
The Transport Scotland Trunk Road Inspection Manual (TRIM, 2019) sets out the procedures for undertaking inspections, including inspection frequencies, and guidance on defects which should be entered into the RMMf database. Defects are classified into two categories, namely:
- Category 1 – defects that are likely to constitute a danger to the public and road users and require immediate or urgent attention; and
- Category 2 – defects that are deemed not to represent an immediate or imminent hazard, but need to be addressed as part of planned maintenance work.
As the study was focussed on early life pavement failures, which will contain early life defects, a search was carried out for Category 1 and Category 2 defects recorded between 2015 and 2019, i.e. the data search was restricted to pavements between zero and five years old. The data was then broken down further into types of defect (potholes, cracks, fretting, etc), severity (Category 1 or 2) and the four geographical areas covered by the OCs.
Cat 1 & Cat 2 defects recorded between 2015 and 2019
The data examined in this section is based on Category 1 (Cat 1) and Category 2 (Cat 2) defects recorded within the boundary of a structural maintenance scheme (known as Series 0100 code). Where the extents of a scheme coincided with locations where defects had been recorded, then a separate list of defects was created and linked to that scheme. The numbers should be regarded as a best estimate as data for some of the schemes was incomplete and this occurred across all the OC units. Examples of incomplete data included missing chainages, transverse lane location, material data, and scheme ID. Any scheme that was incomplete was omitted from the analysis. Other assumptions made during the analysis included:
- Defects
- Each scheme was examined to identify clusters of defects, i.e. > 1 defect, to determine whether any defects related to surface material were recorded, e.g. potholes, fretting and cracking.
- Single defects or non-material defects such as cracking around gullies were omitted.
- Chainages
- In general, all carriageway defects recorded within the extent of a scheme were included in the analysis. However, some defects that were closely located to the periphery or boundary of a known scheme extent were omitted. This was done to provide some allowance for any chainage discrepancies, i.e. overlap between schemes.
Figure 2-1 shows the annual number of structural maintenance schemes (coloured blue) that were completed in each year between 2015 and 2019. The histogram also shows the associated number of schemes where Cat 1 and Cat 2 defects were recorded (coloured red) over the five-year period.
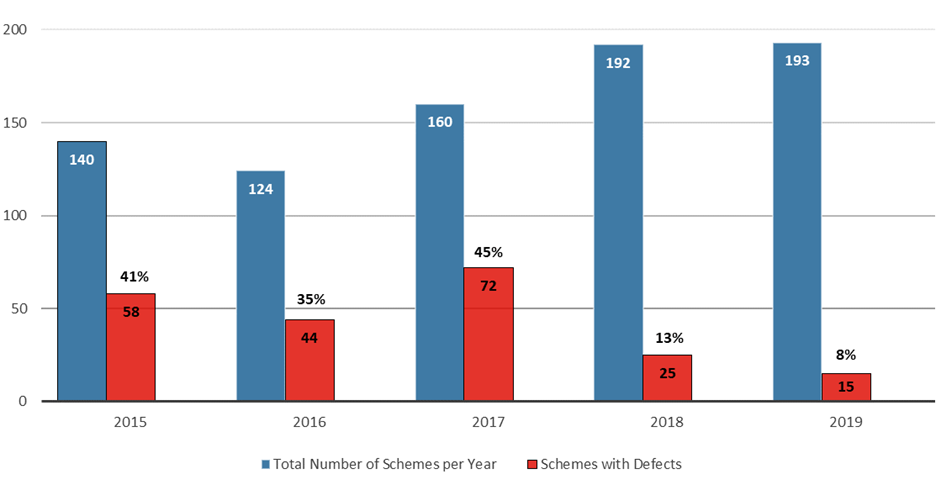
The number of schemes with defects is aggregated over the five-year period, so it is expected that older schemes will record more defects than the younger schemes. However, it is notable that schemes constructed in 2017 recorded a comparably higher number of defects.
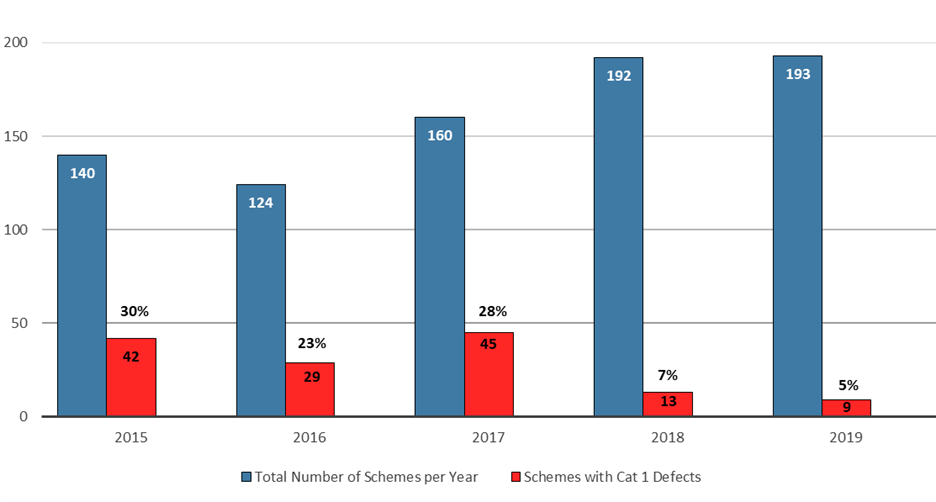
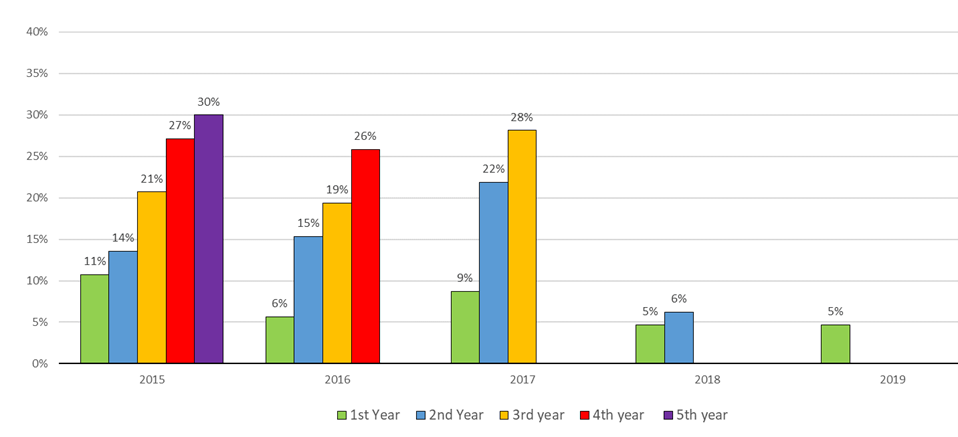
Cat 1 defects
The histogram in Figure 2-2 shows the number of schemes that recorded Cat 1 defects over the five-year period. It can be seen that the percentage of schemes with defects has reduced when compared to Figure 2-1, which includes Cat 1 and Cat 2. The figure shows that five per cent of schemes constructed in 2019 exhibited Cat 1 defects, i.e. nine schemes exhibited two or more significant defects shortly after completion and within one year. The graph also shows that 30%, or 42 schemes constructed in 2015 had recorded a Cat 1 defect over the five-year period.
Development of Defects
In an attempt to gauge whether the occurrence of defects has been increasing or decreasing over the five-year period of the study, the database was analysed to determine the number of schemes that recorded Cat 1 and Cat 2 defects within the first year of construction. Figure 2-3 shows the total number of schemes constructed each year along with the number of schemes that recorded Cat 1 defects and the number defect records. In percentage terms, the proportion of schemes affected in the first year ranges between 5% and 11%.
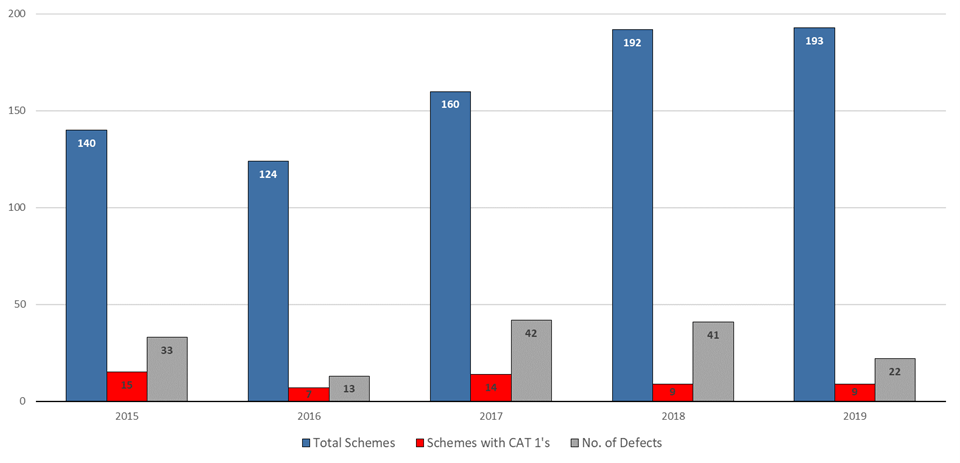
Figure 2-4 shows a similar graph for schemes that recorded Cat 2 defects within the first year of construction, including the number of defect records. In percentage terms, the proportion of schemes affected in the first year was slightly higher than Cat 1 ranging between 5% (2019) and 17% (2016).
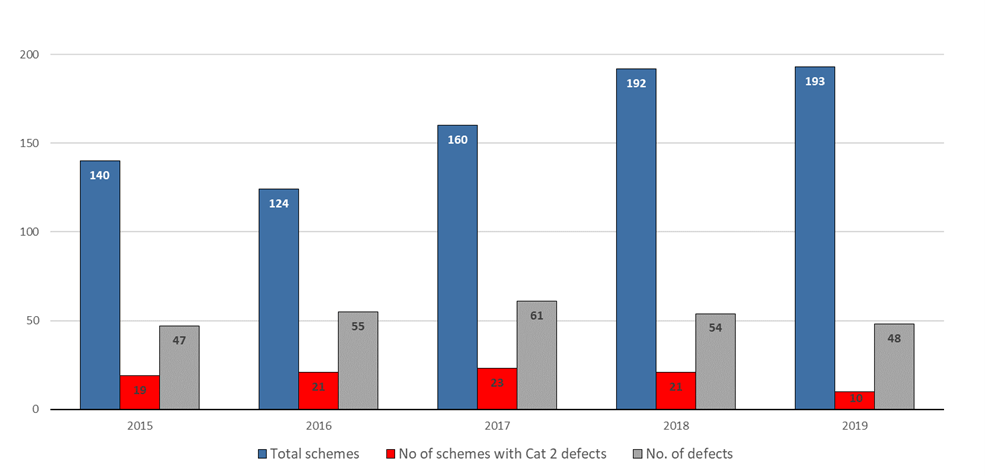
The results in Figure 2-4 are interesting in that Cat 2 defects are commonly associated with wear and tear of the road materials and would be expected to occur later in the life of the surfacing. However, Cat 2 defects include faults such as fretting, chip loss and open joints and these are known to occur early in the life of a surfacing.
It was decided to investigate the development of both Cat 1 and Cat 2 defects over the five-year period of the study. The development of Cat 1 and Cat 2 defects is shown in Figure 2-5 and Figure 2-6, respectively.
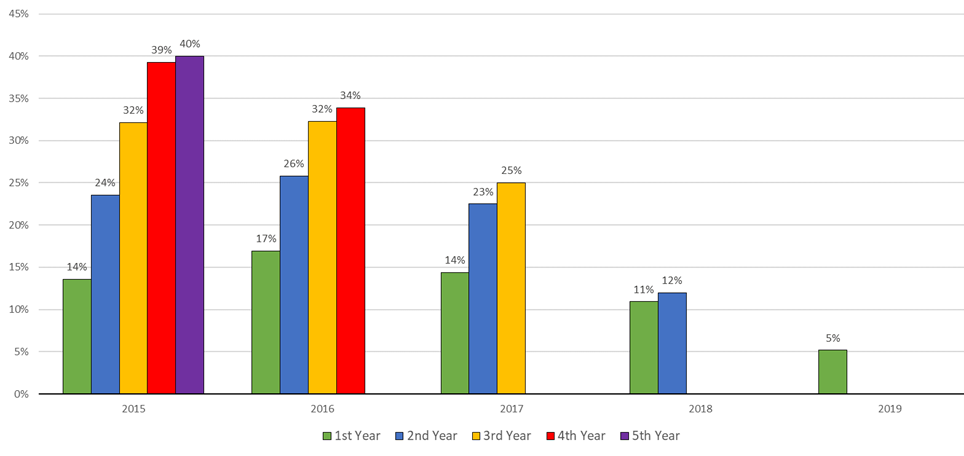
The development of the defects can be seen and compared, particularly for the older schemes which possess more data. It can be seen from Figure 2-6 that after five years in service, 40% of the 2015 schemes have recorded Cat 2 defects, this compares to 30% of Cat 1 defects over the same period (Figure 2-5).
Cat 1 and Cat 2 defects by OC area
The pie charts in Figure 2-7 and Figure 2-8 show the proportion of Cat 1 and Cat 2 defects recorded in the OC areas between 2015 and 2019, respectively. Figure 2-7 highlights that the highest number of Cat 1 defects was recorded in the SW and the lowest in the NE. Figure 2-8 shows a slightly more even distribution for Cat 2 defects recorded across the trunk road network with the highest number recorded in the NW. However, the picture changes if we look at the number of schemes that contain defects by OC area. Figure 2-9 illustrates the fact that some individual schemes attract a much higher number of defects compared to others, e.g. although the SW attracted the highest number of Cat 1 defects overall, the number of schemes affected was the same as the NW.


Types of defects
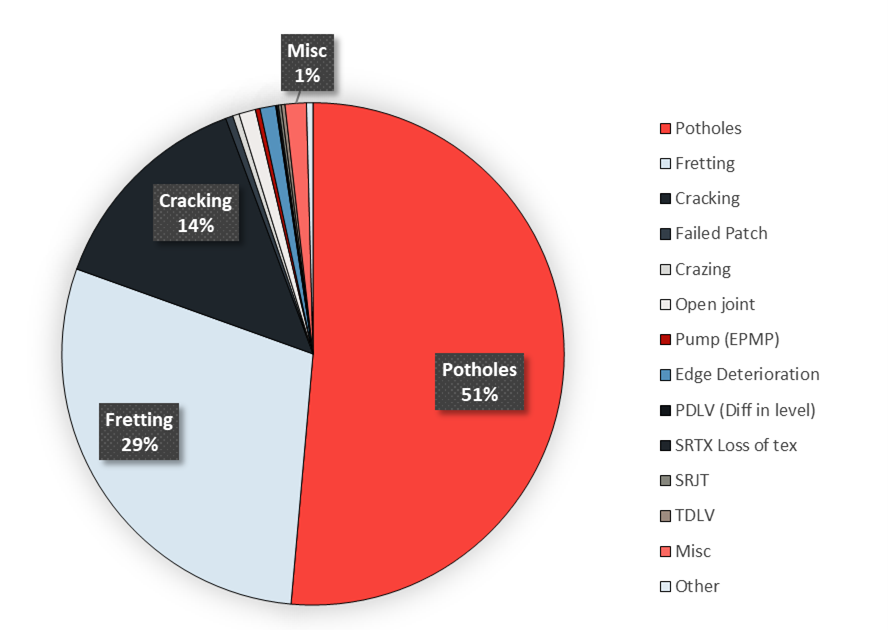
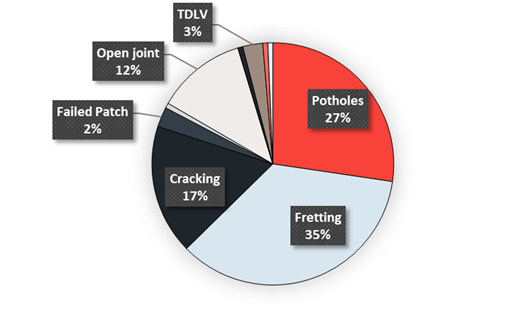
Figure 2-10 shows the type and proportion of surface defects recorded across the entire Scottish road network maintained by the OCs between 2015 and 2019.
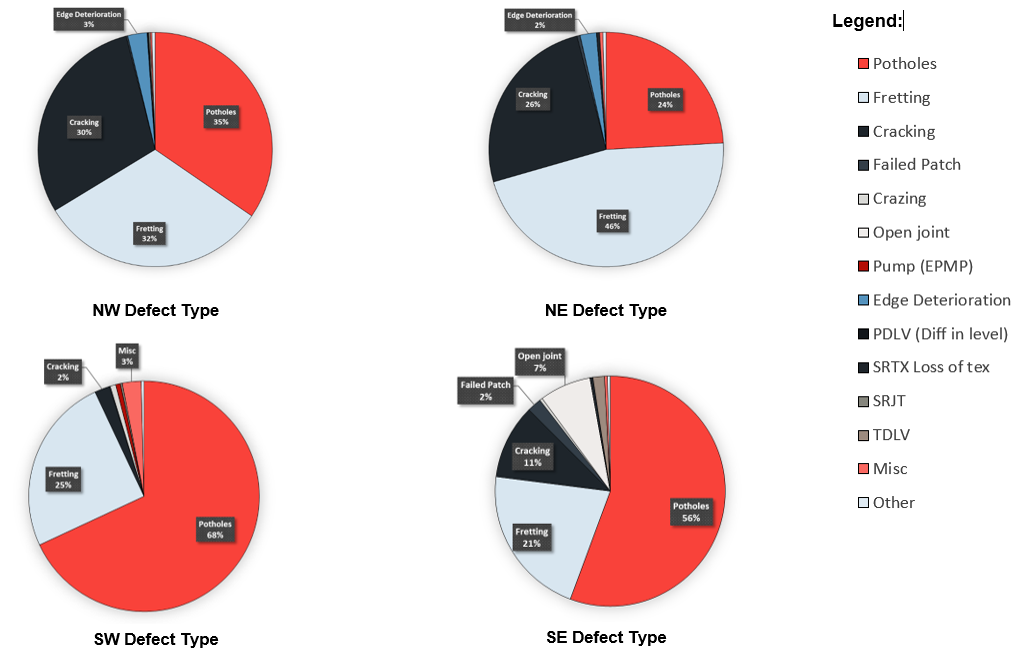
To investigate how defect types are influenced by geographical area, i.e. NW, NE, SW and SE, the data collected by the four operating units was separated and is shown side by side in Figure 2-11. It can be seen that both fretting and cracking, and to a lesser extent edge deterioration, appear to be the dominant defects recorded in the northern parts of Scotland. In contrast, the occurrence of potholes is the major defect recorded in the south.
A possible explanation for the increased presence of fretting in the NW and NE could be related to different material configurations. It is known that mixtures with a larger nominal aggregate size (14mm) are more common in the north of Scotland and these materials are known to fret under high stress situations (McHale et al, 2017). Cracking and edge deterioration could be related to factors such as narrower road construction, leading to vehicle overrun, and a poorer provision of road drainage. It is unclear why the pothole count is high in the south but it is likely that this could be related to the higher traffic levels experienced in the SE and SW units, which include the main central commuting belt within Scotland.
IRIS data summary
Information collected as part of regular inspections and patrols allowed the number, type and timing of defects to be quantified over a five-year period. Analysis of the data also provided some insight into how surfacing schemes deteriorate with time.
Nearly 100% of the Cat 1 defects recorded across the OC operating areas were related to potholes or failed patches which required immediate attention. Figure 2-11 shows that they occur more in the SW of Scotland, with 64% of Cat 1 defects being recorded in this area. However, it is important to note that this high number of Cat 1 defects does not mean that more schemes were affected in the SW than elsewhere, rather some individual schemes in the SW attracted a very high number of Cat 1 defects. It is unclear why the Cat 1 count is so high in the SW, but the wetter climate on the west coast and the fact that the area contains Glasgow, which has the largest traffic volume of Scotland’s major cities, may be two related factors.
The descriptions associated with Cat 2 defect records are much more varied and include faults such as fretting (aggregate loss), potholes, cracking, crazing, edge deterioration, open joints and other miscellaneous features. Category 2 defects are not judged to signify an immediate or imminent hazard and are more associated with wear and tear of the road materials. Cat 2 defects picked up early in a pavement’s life are likely to provide an indicator of the long term durability of the structural maintenance treatment selected. It is likely that some Cat 2 defects, such as fretting, cracking, crazing and open joints, may provide a precursor to the creation of a pothole or Cat 1 defect at a later stage.
Figure 2-12 highlights that a significant number of Cat 2 defects were recorded as potholes in the SE over the five year period. Across the four OC units, the proportion of CAT 2 defects with the description ‘pothole’ was small apart from the SE, viz. 6% (NW), 3% (NE) and 8% (SW). It is unclear why the pothole description was used so much in the SE. It is possible that some entries were erroneous or that the inspector deemed certain types of potholes did not pose a risk to road users, but this does not explain the high usage of this type of Cat 2 defect.
Although the incidence of early life defects appears to be relatively low in the first year of a scheme’s construction, it is of concern that the defect count increases sharply with time. The data suggests that after five years in service, 40% of the schemes constructed in 2015 had recorded Cat 2 defects, and 30% of the schemes had recorded Cat 1 defects. As Cat 1 defects are repaired quickly, it is expected that the sum of Cat 1 defects should be less than the Cat 2 defect total. Nonetheless, it is of concern that after five years in service that the defect count should be so high.
Analysis of the data showed that the defect count can vary from year to year and that the type and quantity of recorded defects varies across the country. The data showed that the scale or level of deterioration at an individual scheme level can vary considerably, i.e. one scheme may record several defects while others have recorded well in excess of 100 defects. The picture is further complicated by the fact that some scheme defects will be treated and repaired, explaining fluctuations in numbers from year to year. It is also clear that some defects are confined to a small area, whereas others are more widespread throughout a scheme.
In summary, the main findings from the analysis of IRIS are as follow:
Category 1 defects
- Nearly 100% of the Cat 1 defects recorded across the OC operating areas were related to potholes or failed patches.
- Over the five-year period Cat 1 defects accounted for approximately half of all the recorded defects.
- Most of the Cat 1 defects (64%) were recorded in the SW of Scotland, although some individual schemes in the SW attracted a very high number of Cat 1 defects.
- The lowest proportion of Cat 1 defects was recorded in the NE of Scotland (6%) with the SE and NW recording 13% and 17%, respectively.
Category 2 defects
- Cat 2 defect records are much more varied and include faults such as fretting (aggregate loss), potholes, cracking, crazing, edge deterioration, open joints and other miscellaneous features.
- Cat 2 defects account for 49% of all defects recorded.
- In the SE, 27% of Cat 2 defects were recorded as potholes, this compares to 6% (NW), 3% (NE) and 8% (SW). It is not clear why the high usage of this type of Cat 2 defect was used in the SE.
Defect types
- Fretting and cracking, and to a lesser extent edge deterioration, appear to be the dominant defects recorded in the northern parts of Scotland.
- The occurrence of potholes is the major defect recorded in the south of Scotland.
Development of defects
- The annual frequency of Cat 1 defects being recorded in the first year of construction for schemes constructed between 2015 and 2019 ranged between 5 and 11%.
- The annual frequency of Cat 2 defects being recorded in the first year of construction for schemes constructed between 2015 and 2019 ranged between 5 and 17%.
- Of the 140 schemes originally built in 2015, 30% had recorded Cat1 defects and 40% recorded Cat 2 defects after five years in service.
Consultation with OC representatives
Requests for information were sent out to the four regional OC units in Scotland, i.e. NW, NE, SW & SE. The OCs were asked to provide any information they had on early life failures that had occurred on recent maintenance schemes (≤ 5 years), including:
- defects that had appeared unexpectedly, particularly within weeks or months of a scheme completion;
- images of defects;
- information on the maintenance scheme that exhibited early life defects, e.g. inlay depth, overlay depth, etc.;
- any comments or observations associated with undertaking remedial work; and
- information on any pavement investigations carried out, including any lessons learnt.
The information provided by the OCs is summarised in Appendix A.
Selected early life defect sites
Based on a review of the information supplied by the OCs and additional data held on IRIS, the schemes listed in Table 2-1 were selected as having the potential to provide useful information on the cause of early life defects. The findings of the detailed investigations are discussed in Chapter 3.
Table 2-1 - Schemes identified for further investigation
|
Area |
Scheme ID |
Route |
Layer date |
IRIS defect description |
|---|---|---|---|---|
|
NW |
18/NW/0102/006 18/NW/0103/095 16/NW/0103/038 18/NW/0103/133 |
A887 A82 A82 A82 |
May 18 Sep 18 May 17 Sep 18 |
Total 37: fretting (37) Total 2: pothole (2) Total 5: cracking (4) & pothole (1) Total 60: pothole (48) & fretting (12) |
|
NE |
17/NE/0103/031 17/NE/0103/015 17/NE/0103/016 17/NE/0103/018* 18/NE/0103/004 |
M90 M90 A9 A9 A95 |
Nov 16 Nov 18 Apr 17 Apr 17 Jul 18 |
Total 10: fretting (5) & potholes (5) Total 4: pothole (3) & cracking (1) Total 20: pothole (11), fretting (5) & Misc. (4) Total 10: dep (5), potholes (3) & fretting (2) Total 8: edge deterioration (6) & cracking (2) |
|
SE |
19/SE/0103/025 20/SE/0103/023 18/SE/0103/049* 17/SE/0103/020 19/SE/0103/009* 19/SE/0103/028 |
A1 A1 A1 A7 A702 M80 |
Nov 18 Aug 19 Apr 18 Nov 17 May 19 Mar 19 |
Total 6: pothole (5) & open joint (1) Total 3: pothole (3) Total 15: pothole (8), crack/diff (5) & misc. (2) Total 5: pothole (2), fretting (1) & crack (2) Total 2: pothole (2) Total 4: pothole (4) |
|
SW |
18/SW/0103/034* 17/SW/0103/005* 19/SW/0103/035* 19/SW/0103/015* 19/SW/0103/010 |
A77 A77 A77 A737 M80 |
Oct 19 May 17 Sep 19 Jul 19 Sep 18 |
Total 1: pothole (1) Total 93: potholes (85), fretting (5) & heaving (3) Total 11: potholes (6); fretting (4) & rutting (1) Total 3: pothole (3) Total 6: pothole (6) |
Key: *Highlighted by OC representative