Improves Our Health and Wellbeing
Proportion of Short Journeys Made by Active Travel
Looking at journeys under two miles in 2023, 52% of all trips were made by active modes. Of all journeys made under two miles, 51% were by walking and 2% were by cycling. These figures are higher than in 2019, when 49% of trips were made by active modes.
In a similar pattern to 2019, those on the 30% of lowest incomes made 57% of these journeys by active modes, compared to 49% of those in the highest 30%. Among the younger age groups, 20–29-year-olds made 62% of their trips by active modes, compared to 43% of those aged 80+.
Looking at journeys under 5 miles, 39% of all trips were by active modes. Of these trips, 37% were by walking while 2% were by cycling. These figures are higher than in 2019, when 35% of trips were made by active modes.
In 2023, a higher percentage of journeys under 5 miles were made using active travel modes by people in the lowest 30% of the income distribution (45%) compared to the highest 30% (35%). Among men, 40% of the journeys under five miles were made by active modes, compared to 38% of the journeys made by women. Travel by active travel modes also varies in terms of age, with those aged 20-29 making 54% of their journeys by active methods, compared to 38% of those aged 50-59.
Transport Casualties and Accidents by Exposure and by km Travelled by Mode
Overall Casualties
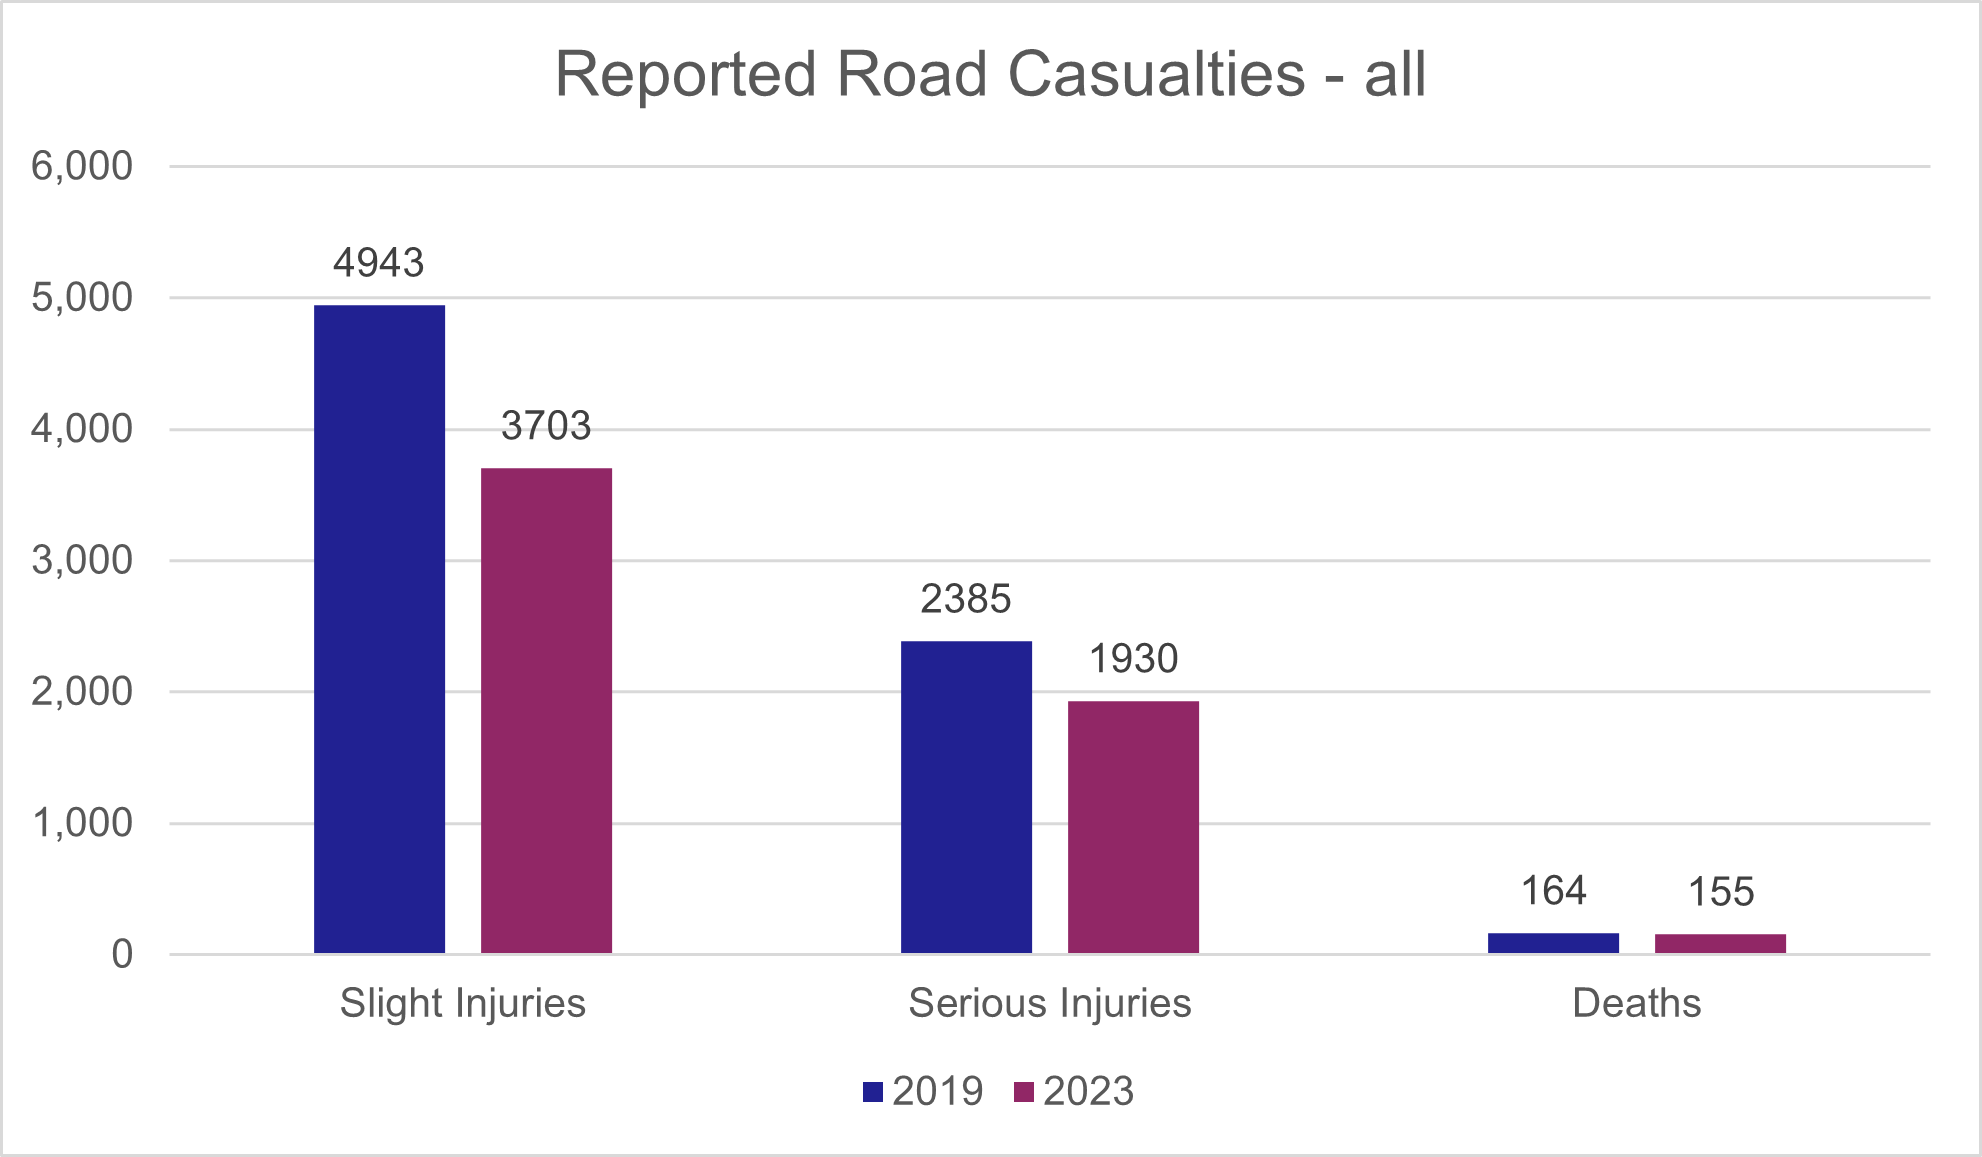
In 2023, there were 5,788 overall casualties. This is 25% lower than in 2019. These included:
- 3,703 slight injuries, 1,240 less that in 2019;
- 1,930 serious injuries, 455 less than in 2019; and
- 155 deaths – nine less than in 2019.
Among adults (aged 16 and over), this was 5,207 overall. This included:
- 3,302 slight injuries
- 1,755 serious injuries
- 150 deaths
Among children (aged 0-15) this was 578 overall, 191 less than in 2019. This included:
- 398 slight injuries
- 175 serious injuries
- 5 deaths
Figure 11 below shows reported road casualties by severity for 2019 and 2023.
By Geography
As in 2019, overall casualties in 2023 were highest in Glasgow City, at 725, and lowest in the three island Local Authorities. In 2023, the Orkney Islands had the lowest number of casualties, at 13.
In 2019, Highland and Fife, had a relatively high number of deaths, and this was the case again in 2023 (both 14). However, Glasgow had the highest number of deaths, at 15.
However, there is a slightly different pattern per capita.
As in 2019, casualties in 2023 were highest in Argyll & Bute, at 1.93 casualties per 1,000 people (170 total casualties from 87,920 people).
Fatalities were also highest in this area, at 0.1 fatalities per 1,000 people (10 fatalities out of the population above).
By SIMD decile of the person involved
As in 2019, in 2023 casualties generally increased with deprivation decile of person involved. Overall casualties were highest among those who lived in the most deprived 10% of areas in Scotland and were lowest among those in the least deprived 10%.
As in 2019, this broad relationship held for different types of road users. The key exception was once again pedal cyclists, who had the highest number of adult casualties amongst those living in the 10% least deprived areas.
By SIMD decile of the location of the accident
When looking at the SIMD decile of the location where the accident occurred, the trend is more complex. As in 2019, when looking at pedestrians, there appears to be a consistent association between deprivation and volume of casualties. However, as in 2019, when it comes to casualties associated with motor vehicle drivers/passengers, the link between the deprivation of the location and the volume of casualties is less clear, and the most deprived locations are not always those associated with the greatest number of casualties. These figures exclude those casualties where the age of the person involved is unknown.
By Demographic
As in 2019, casualties were more common among men then among women in 2023. In 2023, there were 1,327 killed or seriously injured casualties among men and 757 among women. Looking at deaths specifically, in 2023, 112 men died compared to 43 women.
As in 2019, casualties for all severities peaked among those aged 30-39 in 2023, at 567 men and 361 women.
By Mode
As in 2019, the greatest number of casualties was experienced by those in cars in 2023 (3,385 casualties overall). In this year, there were 2,428 slightly injured, 896 seriously injured and 61 killed using this mode.
Among pedestrians in 2023, there were 939 casualties overall, with 429 slight injuries, 463 serious injuries and 47 fatalities. Among pedal cyclists, there were 404 overall casualties, with 239 slight injuries, 158 serious injuries and 7 fatalities.
By Distance
Using distance travelled by modes in Scotland, provided by the Department for Transport, we can estimate the number of accidents by kilometre travelled on each mode. However, it should be noted that, given the nature of the data collection, the figures for pedal cycles are unlikely to be as precise as those for motor vehicles. As a result, statistics should be treated with caution.
Patterns are similar to those previously reported for 2019. In 2023, per million kilometres travelled in a car, there were 0.10 casualties. By contrast, the highest number of casualties was associated with motorcycles (1.58 per million kilometres) and pedal cycles (1.01 per million kilometres).
Regarding fatalities, these were also highest for motorcycles, at 0.09 per million kilometres.
Perceptions of Safety of Public Transport and Active Modes
Walking
Within the data provided by the Scottish Household Survey, 1% of the population cited ‘not safe’ as a barrier to walking more frequently than they do. This proportion has remained consistent since 2012, with the question being asked in 2019, 2021 and 2023. Because the sample size of the those providing this answer was so low, a breakdown by demographics is not available.
However, it is worth noting that the Scottish Crime and Justice Survey collects data on the proportion of adults that felt safe walking alone in their local area. This survey notes that, in 2021-22, 76% of respondents felt safe in this context. This is similar to the figures for 2019-20 (77%). More specifically, 63% of women felt safe, compared to 90% of men.
In addition, 59% of those in the 15% most deprived areas felt safe compared to 79% of those in the rest of Scotland (reported in the data tables accompanying the survey).
Cycling to Work
Within the data provided by the Scottish Household Survey, there were two answers to the question asking for ‘Reasons why do not cycle to work’ that relate to personal safety. These are ‘Concerns about cycling in traffic’ and ‘Concerns for personal safety on dark/lonely roads’. This data has been disaggregated in a bespoke breakdown provided for this report.
In relation to concerns about traffic, this was reported by 17% of respondents in 2023. Although this was slightly higher among women (18%) than among men (16%) the difference was not statistically significant.
In relation to concerns about personal safety on dark/lonely roads, this was reported by 7% of respondents in 2023. This was similar for women and men (both 7%).
Bus
In 2021, perceptions of safety were higher during the day than in the evening. During the day, 95% of bus users agreed they felt safe and secure using the bus. By contrast, 70% agreed that they felt this way using the bus in the evening, while 11% disagreed. This is similar to the baseline position in 2019.
Looking at specific groups:
Disagreement with feeling safe and secure during the evening was higher among women, at 15%, compared to 5% among men. It was also higher among disabled people (at 21%) compared non-disabled people (at 7%).
Disagreement was also higher among those in the lowest 30% of incomes, at 14%, compared to those in the highest 30% of incomes, at 8%.
Additional survey research, undertaken by Transport Focus on behalf of Transport Scotland in 2023, reports that 87% of bus users rated their personal security whilst on the bus as being fairly or very good.
Train
In 2023, among those who had used the train in the last month, 96% agreed that they felt safe and secure using the train during the day. By contrast, 80% agreed that they felt this way during the evening, while 8% disagreed. This is broadly similar to the baseline position though there has been in an increase in the proportion of people agreeing that they feel safe and secure using the train in the evening from 2019 (76%).
Disagreement was higher among women compared to men (13% compared to 5%) and among disabled people compared to non-disabled people (15% compared to 7%).
Case Study: Women and Girls’ Safety
In 2022, Transport Scotland undertook a programme of research on the issue of women and girls’ safety on public transport.
The substantive component of research was a qualitative study with women and girls who use and/or work on the public transport system in Scotland.
The study reported that as with growing international literature on this issue, safety on public transport was a significant concern for women and girls in Scotland. The study highlighted that women and girls are already shouldering significant responsibility for adapting their behaviours to try to ‘be’ and to ‘feel’ safe when travelling on public transport.
The study highlighted a range of issues that were relevant and impacted on women and girls’ safety including mode of travel; timing of travel and travel routes; reliability of transport; antisocial behaviour, often exacerbated by alcohol and drug use; unwanted attention, often of a sexual nature; how age, gender and race can compound issues regarding safety; and a perceived lack of support and action to deal with and follow up on incidents where women and girls felt unsafe.
The report made 10 recommendations to improve safety for women and girls on the transport network in Scotland. These ae now being taken forward by Transport Scotland, transport mode operators and relevant stakeholder organisations.
Air Quality
This section considers the two primary air pollutants referenced in the National Transport Strategy, Nitrous Oxide (NOx) and Particulate Matter (primarily PM 10 and PM 2.5). The data comes from the ‘Environment and Emissions’ chapter of the Scottish Transport Statistics Report no. 42 (2023 edition). The difference between PM 10 and PM 2.5 relates to their size, with PM 10 being sized 10 microns and below and PM 2.5 being 2.5 microns and below.
It should be noted that the data does not exhaust the available data on air pollution and air quality monitoring. Further data on these can be found in the links above.
Nitrogen oxides (NOx)
In 2021, 59% of all NOx emissions were from transport, which is a decrease from 2019 when transport comprised 64% of overall emissions. However, this is in a context where both overall and transport related emissions have declined by 75% and 68% respectively since 1990.
Looking at road transport, the relative components of this have changed over time. In 1990, road transport represented 70% of transport emissions, while shipping represented 26%. In 2021, road transport constituted 36% of all transport emissions, while shipping constituted 60%. This is similar to the corresponding 2019 baseline figures that are 37% and 58% respectively.
Particulate Matter (PM 10)
Overall transport related PM 10 emissions have fallen from 7 thousand tonnes in 1990 to 2.1 thousand tonnes in 2021. In 2021, transport related emissions accounted for 17% of all PM 10 emissions, down from 20% in 2019, and the same proportion that was reported in 1990.
Emissions associated with road transport, as a percentage of emissions associated with total transport, increased from 43% in 1990 (when shipping was 53%) to 69% in 2019, and 74% in 2021 (when shipping was 24%). In 2021, in terms of specific components of road transport, 43% was related to tyre and brake wear and 19% was related to road abrasion.
Particulate Matter (PM 2.5)
In 2021, 22% of total PM 2.5 emissions came from transport, compared to 23% in 1990 and 27% in 2019. In absolute terms, however, transport related PM 2.5 emissions fell from 6.4 thousand tonnes in 1990 to 1.9 thousand tonnes in 2019 and 1.5 thousand tonnes in 2021.
Road transport as a component of transport emissions increased from 40% in 1990 (when shipping was 56%) to 60% in 2019 (shipping was 35%), and 65% in 2021 (shipping was 32%). In terms of the specific components of road transport, in 2021, 34% of the total was a result of tyre and brake wear and 14% was a result of road abrasion.
Travel for Recreation/Leisure
Looking at journeys by purpose, 33% of travel is for recreation/leisure, compared to 67% of travel that be characterised as non-leisure.
Leisure travel here includes visiting friends or relatives (10%), going for a walk (10%), sports/entertainment (7%), eating/drinking (4%) and holidays/days trips (1%). Collectively, the proportion of journeys for recreation/leisure has increased since 2019 (from 28% to 33%).
By contrast, non-leisure activities include shopping (24%), commuting/journey in the course of work (21%), going home (6%), education (5%), other personal business (4%), business (3%), visiting hospital or other health reasons (2%) or ‘other’ journeys (2%). Collectively, the proportion of journeys for non-leisure activities has decreased since 2019 (from 72% to 67%)
There are a range differences by group. Some of the most prominent included:
Gender - a larger percentage of men’s trips involved commuting (23%) compared to women (19% of which were commuting). A larger percentage of women’s trips were to education (6%) compared to men (3%).
Age - commuting is highest among 20–29-year-olds, at 28% of journeys, and is lower among those over 60 (14% of those aged 60-69, 2% of those aged 70-79). Education trips are most common among those aged 16-19, at 21%.
Disability - a lower proportion of the trips of disabled people involved commuting (11% compared to 24% of non-disabled people).
Income - a higher proportion of trips of those in the highest 20% of incomes involved commuting (25%) compared to those in the lowest 20% of incomes (10%). By contrast, a higher proportion of those in the lowest 20% of incomes involved shopping (30%) compared to those in the higher 30% of incomes (20%).
Geography - a similar proportion of trips involved commuting in both urban and rural areas (21% in urban areas, 20% in rural areas). This differs from the baseline in 2019, when a higher proportion of the trips of those in urban areas involved commuting (24%, compared to 20% of trips of those in rural areas).