Reduces Inequalities
Walking as a means of transport
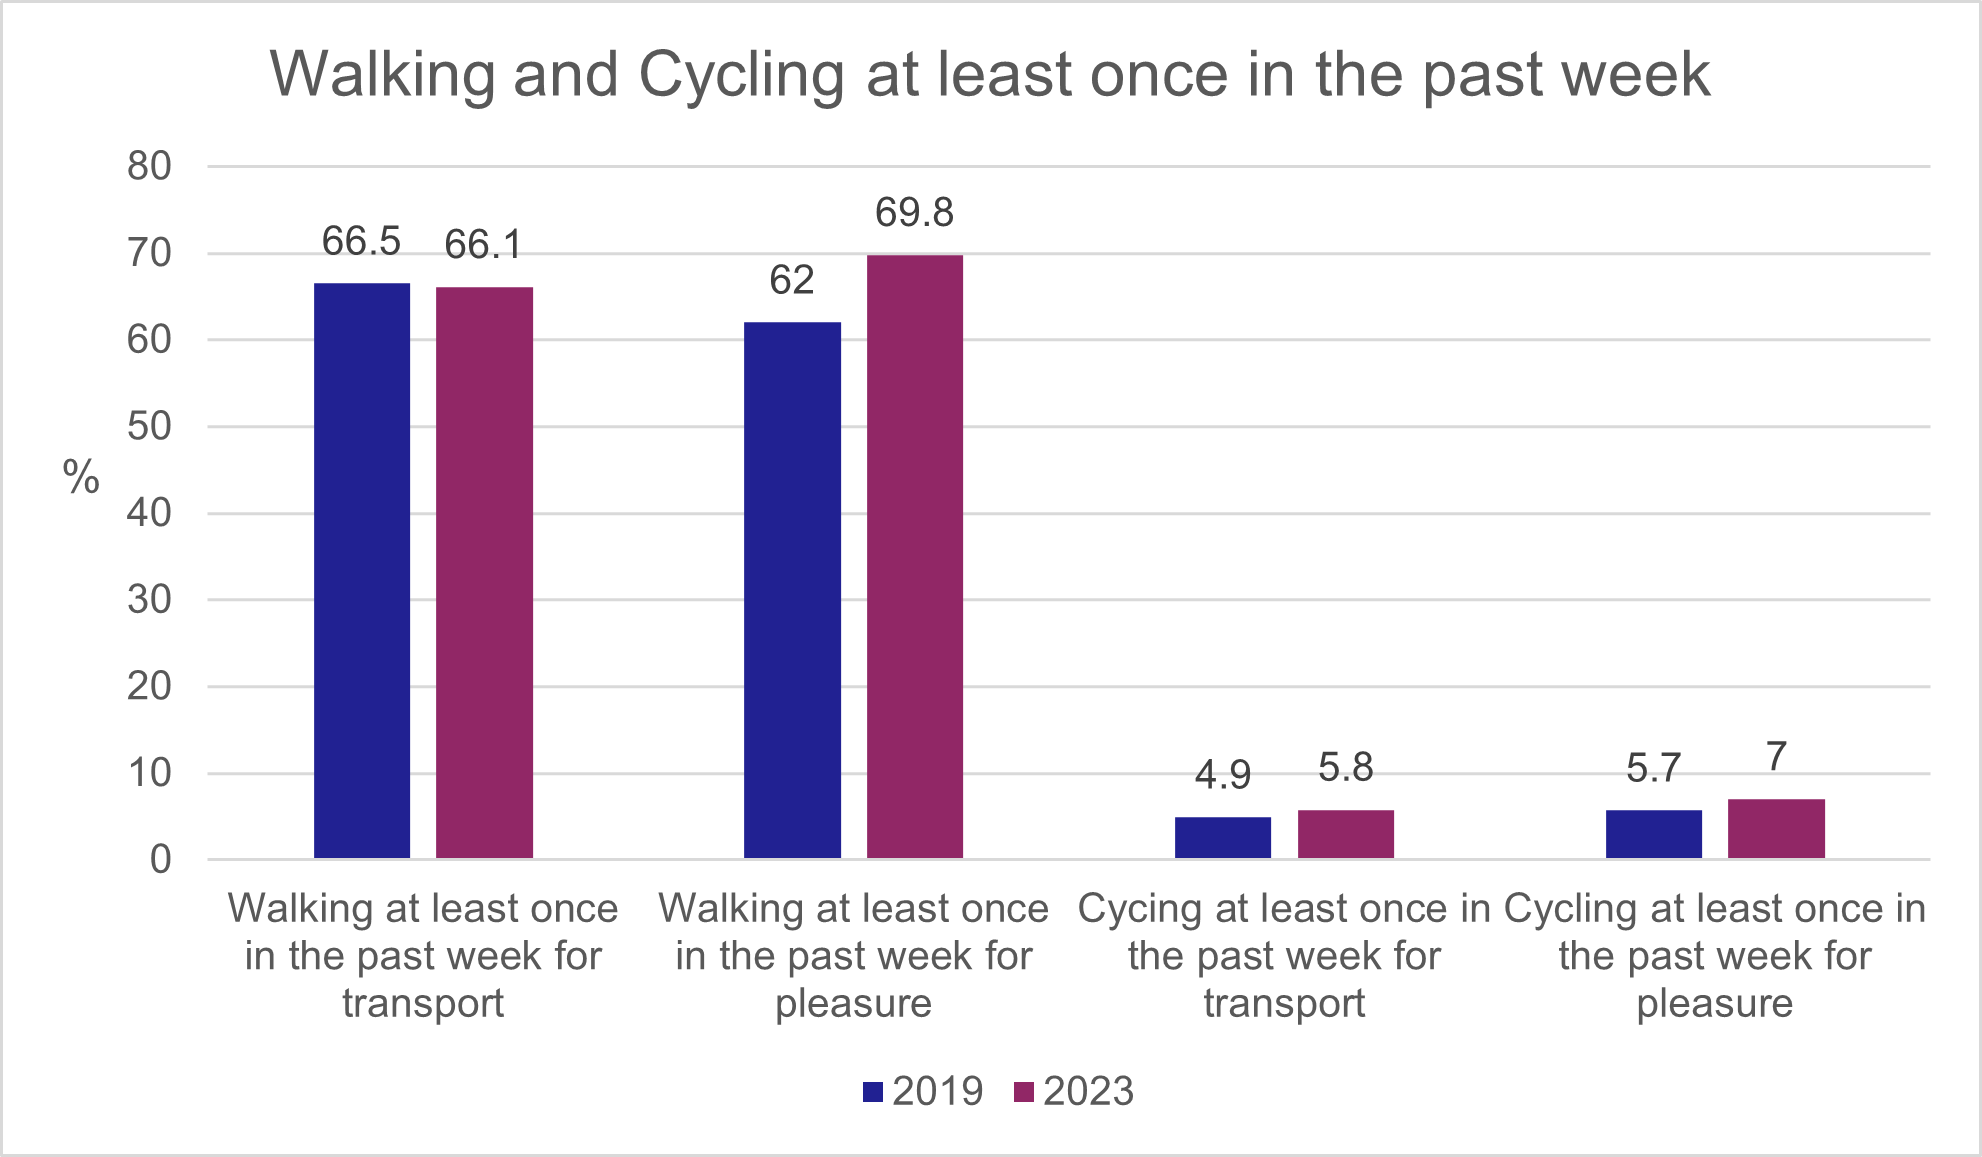
Walking as a means of transport at least one day in the past week was reported by 66% of the population in 2023. This is similar to the baseline position in 2019 (67%). Walking as a means of transport is most common among those living in large urban areas (74%), those on higher incomes (households earning more than £40,000 p.a.) and living in the least deprived areas (73%). There is little difference between men and women with regard to walking as means of transport; and is more common among those aged 49 or under.
Walking as a means of transport was more common among non-disabled people than disabled people, with 71% of non-disabled people doing this at least one day in the last week in 2023, compared to 51% of disabled people.
Walking just for pleasure/to keep fit
Walking just for pleasure/to keep fit at least one day in the past week was reported by 70% of the population in 2023. This is an increase compared to the baseline position in 2019 (62%). It is most common among middle- and higher-income households and in the least deprived areas. A greater proportion of men than women report walking just for pleasure/to keep fit (72% and 68% respectively), and older age groups are least likely to do so.
Walking just for pleasure/to keep fit at least one day in the past week is more common among non-disabled people (77%) than disabled people (49%).
Walking as a means of transport has changed little over time, with around two thirds of respondents doing this in the last week in 2019, 2021 and in 2023. Walking just for pleasure/to keep fit appears to have increased, from 62% in 2019, to 70% of respondents in 2023. This was higher in 2021 (74%) which may be as a result of the COVID-19 pandemic and increased levels of walking and cycling for leisure during this period.
Cycling as a means of transport
Cycling as a means of transport at least one day in the past week, was reported by 6% of all people in 2023, which is similar the 2019 baseline figure (5%). Men (8%) are more likely to report that they have cycled as a means of transport at least one day during the past week than women (4%), as are those from both the lowest and highest income households (9% of those whose household income is over £50,000 p.a.; 8% of those whose household income is less than £10,000 p.a.).
Cycling as a means of transport at least one day in the past week is more common among non-disabled people (7%) than among disabled people (3%).
Cycling just for pleasure/to keep fit
Cycling just for pleasure/to keep fit at least one day in the past week was reported by 7% of the population in 2023. This is similar to the baseline position in 2019 (6%). Men (10%) are more likely to report that they have cycled just for pleasure/to keep fit at least one day in the past week than women (5%), as are those from higher income households (10% of households whose earnings are over £50,000 p.a.) and those in 20% least deprived areas (12%).
Cycling just for pleasure/to keep fit at least one day in the past week is more common among non-disabled people (8%) than among disabled people (4%).
Cycling as a means of transport has remained relatively unchanged over time: 6% of respondents did this at least once a week in 2012, 2014 and 2016, compared to 5% in 2019, 7% in 2021 and 6% in 2023. Similarly, cycling just for pleasure/to keep fit remains relatively unchanged over time, at 6% between 2012 and 2019 and at 7% in 2023. There was an increase to 9% in 2021 which may be as a result of the COVID-19 pandemic and increased levels of walking and cycling for leisure during this period.
Figure 1 below shows levels of walking and cycling at least once in the past week.
Bus use
Among the population as a whole, in 2023, 38% reported using the bus at least once in the last month, with 7% using it every day or almost every day. This is similar to the baseline figures of 2019 which were 39% and 8% respectively. Bus use at least once in the past month is more common among young people, particularly those aged 16-19 (64%); those in large urban areas (56%), those on lower incomes (50% of those earning less than £10,000 p.a.) and those in the 20% most deprived areas (47%). Women (40%) are more likely to report using the bus at least once in the last month than men (35%).
There was no difference between disabled people and non-disabled people regarding bus use at least once in the last month.
Bus use has fallen overall in the last ten years, with journeys declining by from 420 million in 2012-13 to 301 million in 2022-23. Similarly, journey kilometres have also fallen from 327 million in 2012-13 to 275 million in 2022-23.
The proportion of those using the bus in the last month declined slightly between 2014 and 2019. Bus use has recovered since a fall in the pandemic years of 2020 and 2021, and the proportion using the bus in the last month was at a similar level in 2023 compared to 2019. In 2023, 38% of people had used the bus at least once in the last month. This is very similar to the figure in 2019 (39%).
Train use
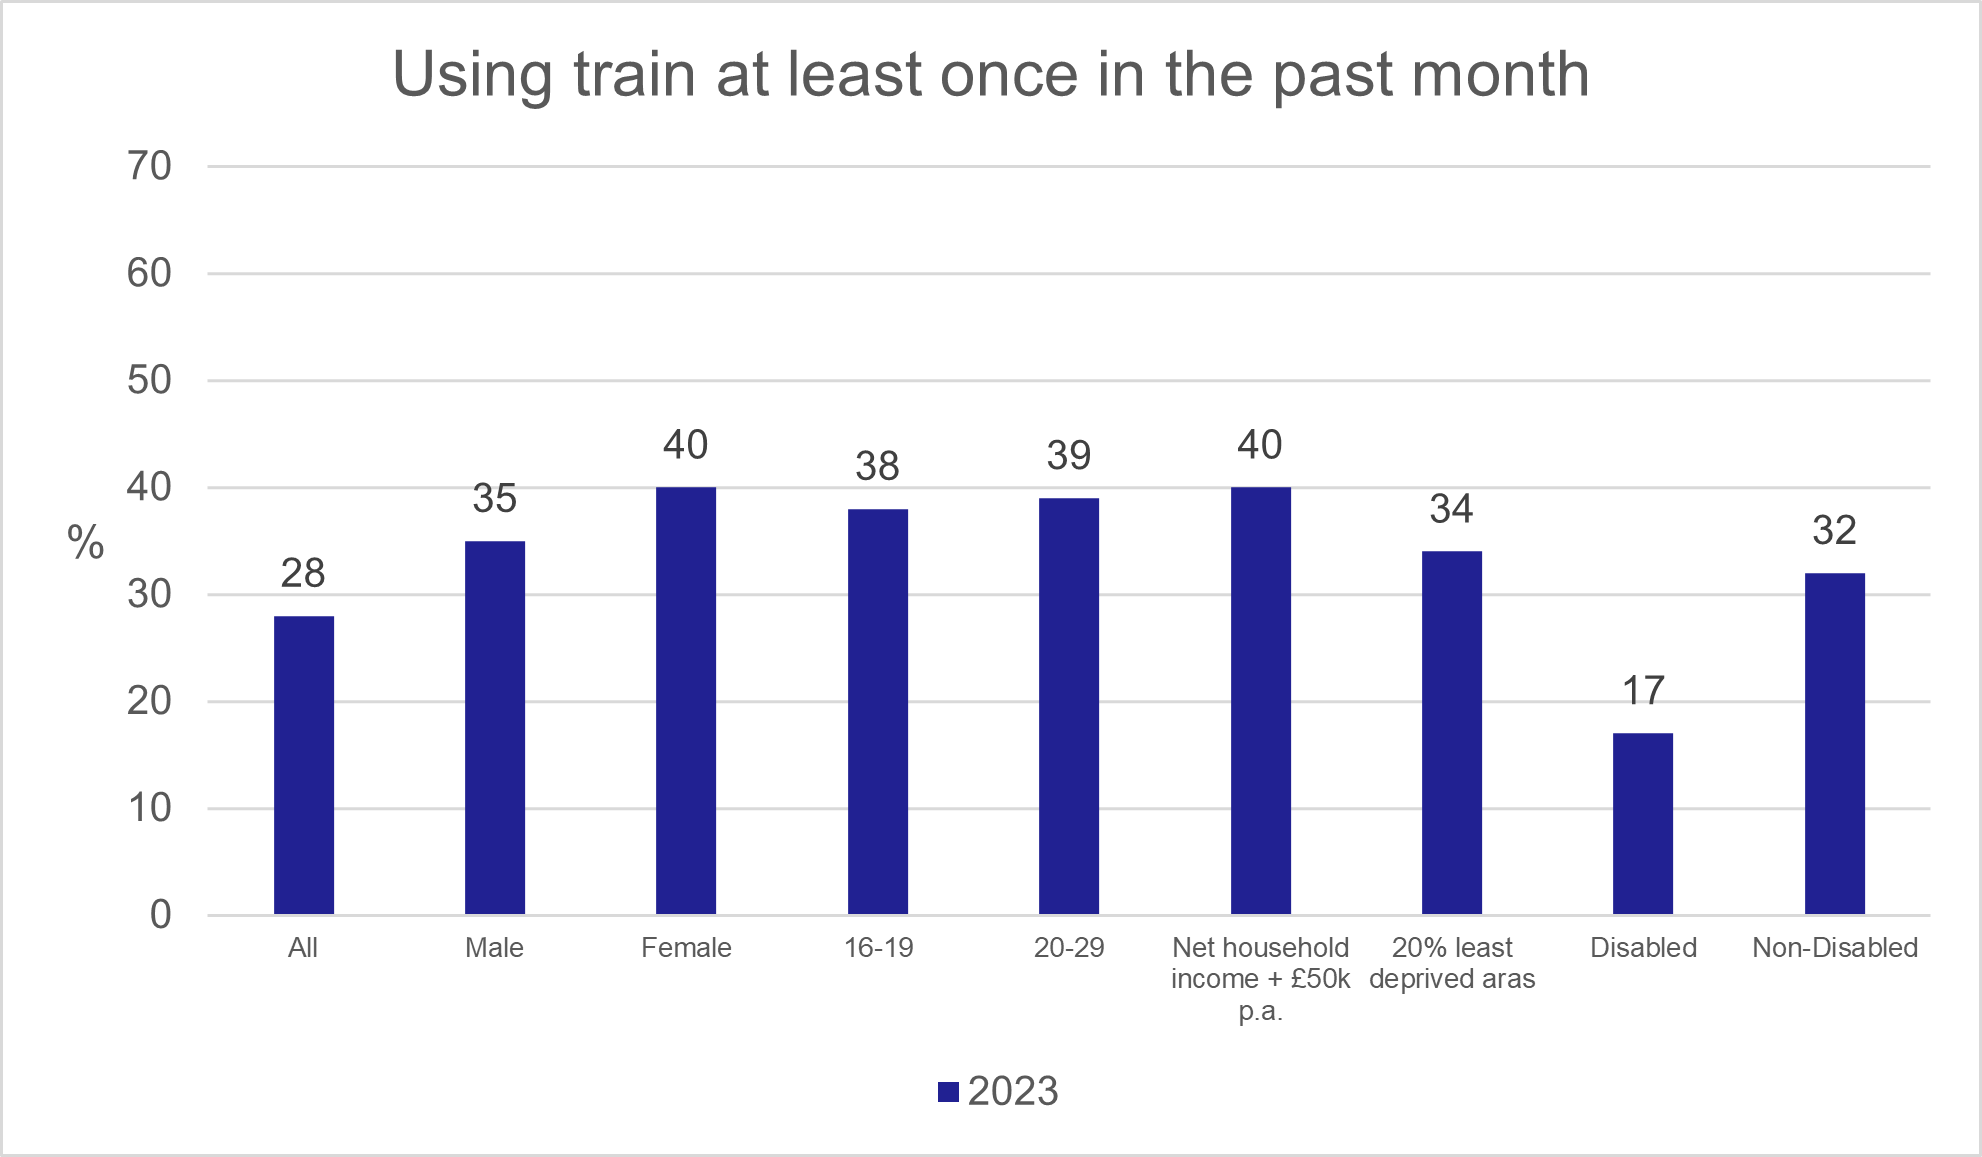
In 2023, 28% of the population reported using the train at least once in the last month This is slightly less than the baseline figure for 2019 which was 30%. Nine per cent of the population used it once a week or more in both 2019 and 2023. Using the train at least once in the last month is more common among those from higher income households (40% of those from households earning over £50,000 p.a.), those in the 20% least deprived areas (34%), those in ‘large urban’ or ‘other’ urban areas (34%), and those aged 16-19 (38%) and aged 20-29 (39%). There is little difference of train use between men and women.
Train use at least once in the last month was less common among disabled people (17%) compared to non-disabled people (32%).
Between 2012-13 and 2018-19, ScotRail passenger journeys had increased from 83 million to 98 million. This dropped significantly during 2020-21 and 2021-22 as a result of the COVID-19 Pandemic. Passenger journey numbers in 2022-23 are at 64 million as rail patronage continues to recover from the effects of the pandemic.
Overall, the proportion of people that report using the train in the last month was 28% in 2023. This is similar to proportions observed between 2014 and 2019 which had been around 30%, but an increase since 2022 where the figure was 24%. Figure two below shows levels of bus and train use at least once in the past month.
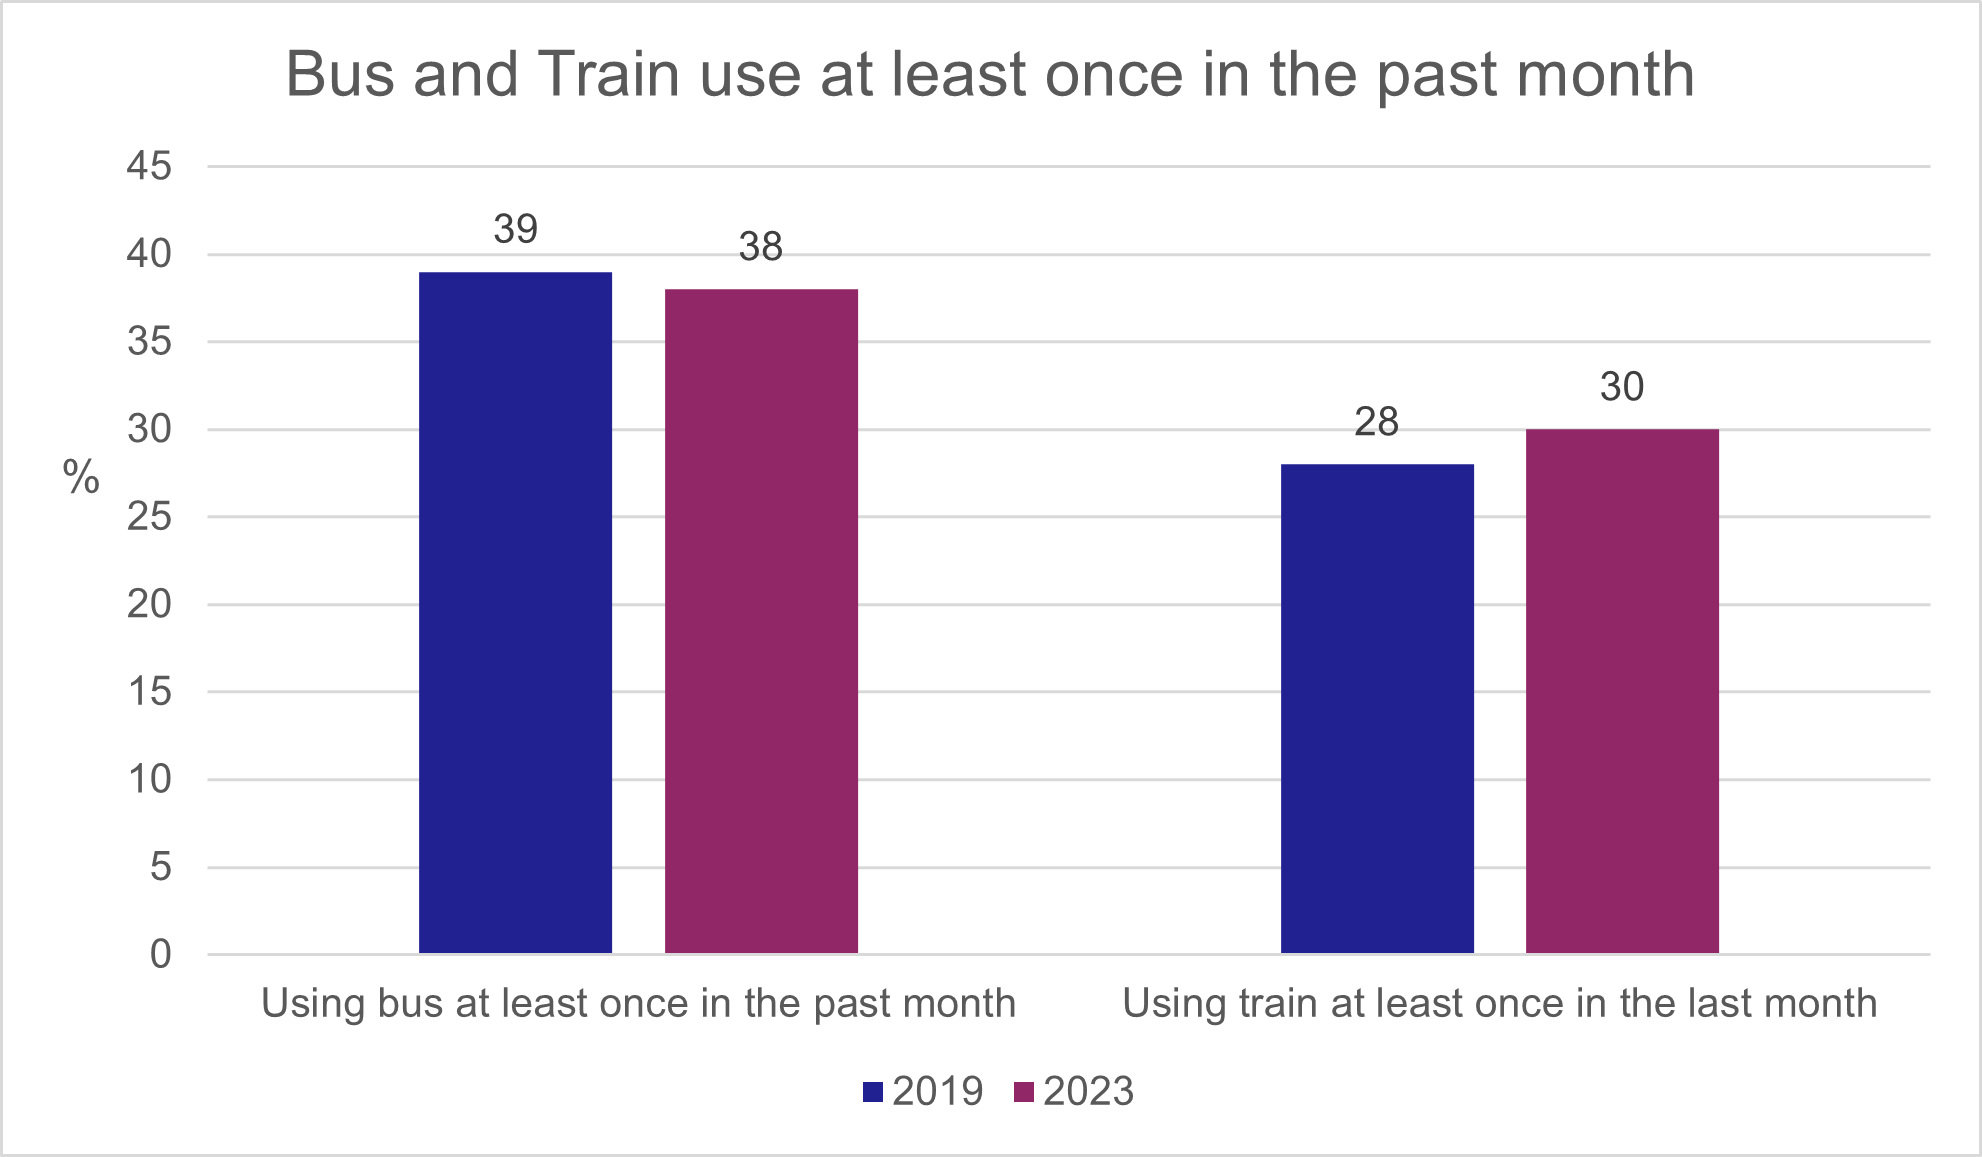
Figure three below shows bus use at least once in the past month by selected demographic and socioeconomic characteristics.
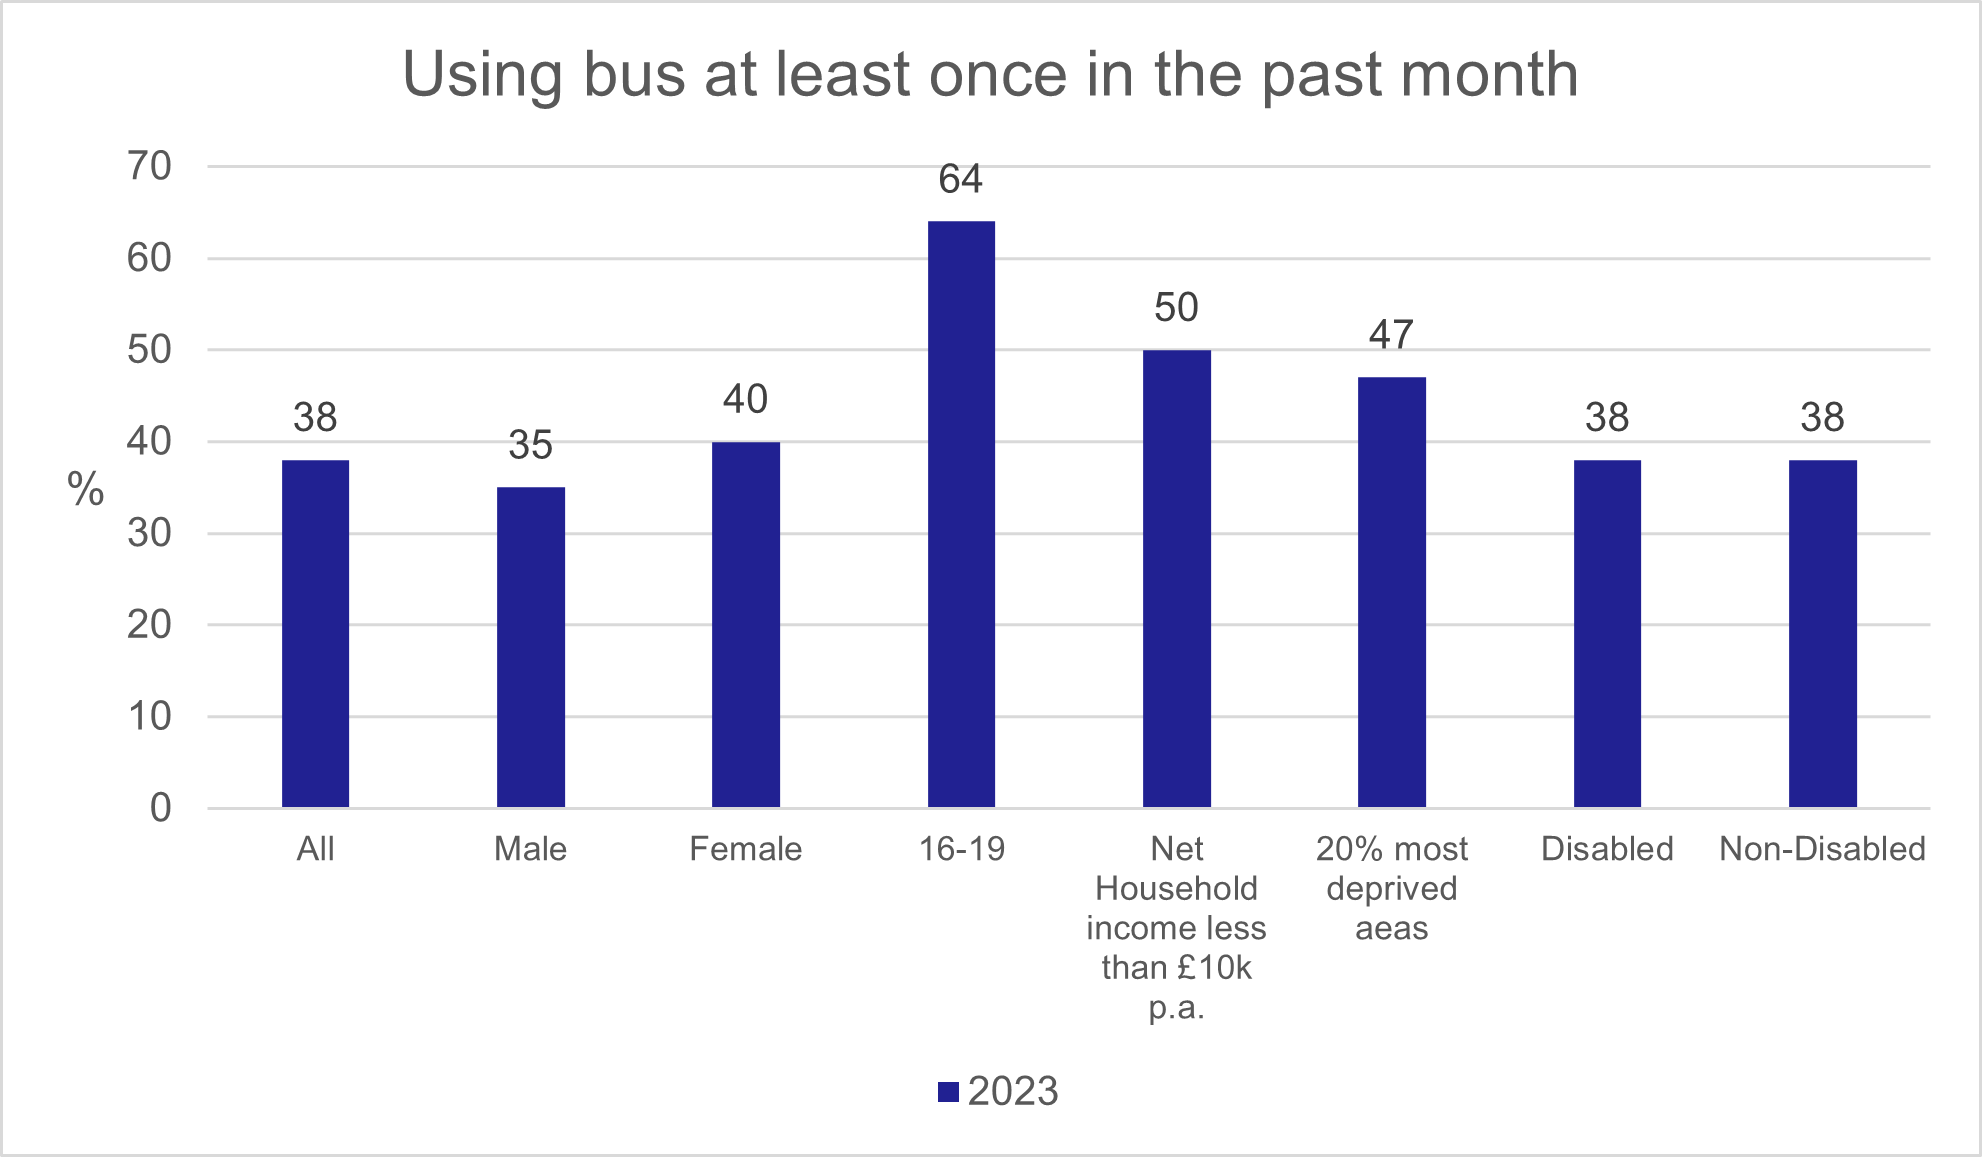
Figure four below shows train use at least once in the past month by selected demographic and socioeconomic characteristics.
Satisfaction with Public Transport
The proportion of all survey respondents stating that they were very or fairly satisfied with public transport in 2023 was 64%, a four-percentage point drop from 2019 (68%). Satisfaction with public transport was higher amongst actual users of public transport (those that had used bus or train in the past month) with 74% of users reporting that they were satisfied in 2023. This is similar to levels of satisfaction recorded in 2019 (76%). When looking specifically at bus and train users, 77% of bus users and 71% of train users reported that they were satisfied with public transport.
Satisfaction with public transport was lowest in rural areas. Satisfaction rates for those living in remote rural and accessible rural areas (47% and 46% respectively) contrasted with a satisfaction rate of 72% for those living in large urban areas.
Barriers to Cycling to work
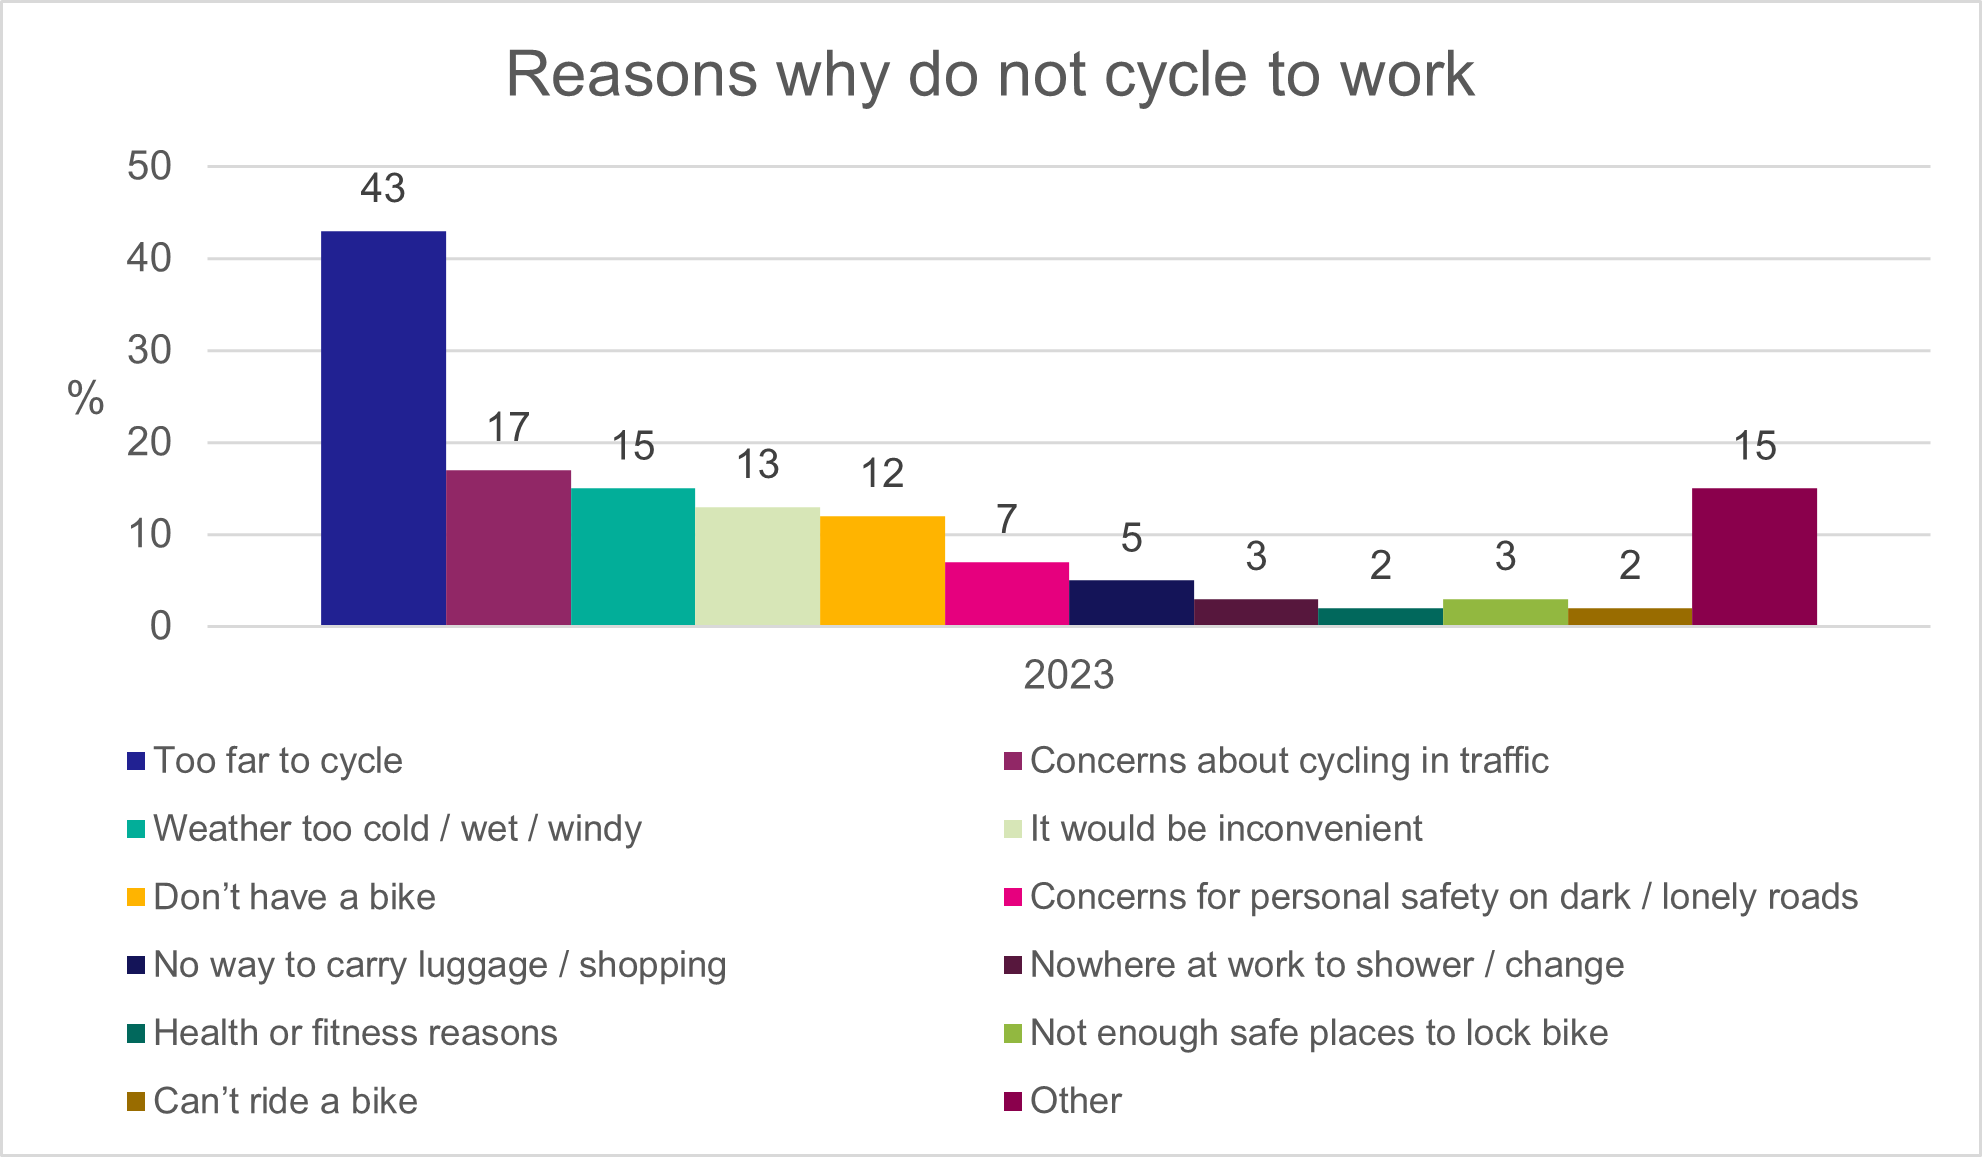
In 2023, the most prominent barrier to cycling to work was ‘too far to cycle’, reported by 43% of respondents. An additional 17% reported that there were ‘concerns about cycling in traffic’, and 15% that the weather was too cold/wet/windy. In addition, 13% reported it would be inconvenient.
The answer ‘too far to cycle’ was higher in rural areas, at 58%, compared to urban areas, at 39%.
Lack of access to bikes – reported by 12% overall – was higher for women, at 17%, compared to men, at 7%. This was also higher in urban areas at 13% compared to rural areas at 7%.
Figure five below shows the reasons why people do not cycle work.
Barriers to walking
The main discouraging factors from walking more often cited by people in 2023 were health reasons or unable to walk far (16%) and the weather (11%). This is similar to the 2019 baseline. Forty two percent of people said that “nothing” discouraged them from walking more often than they do which is a reduction from 2019 levels (55%).
Barriers to Bus Use
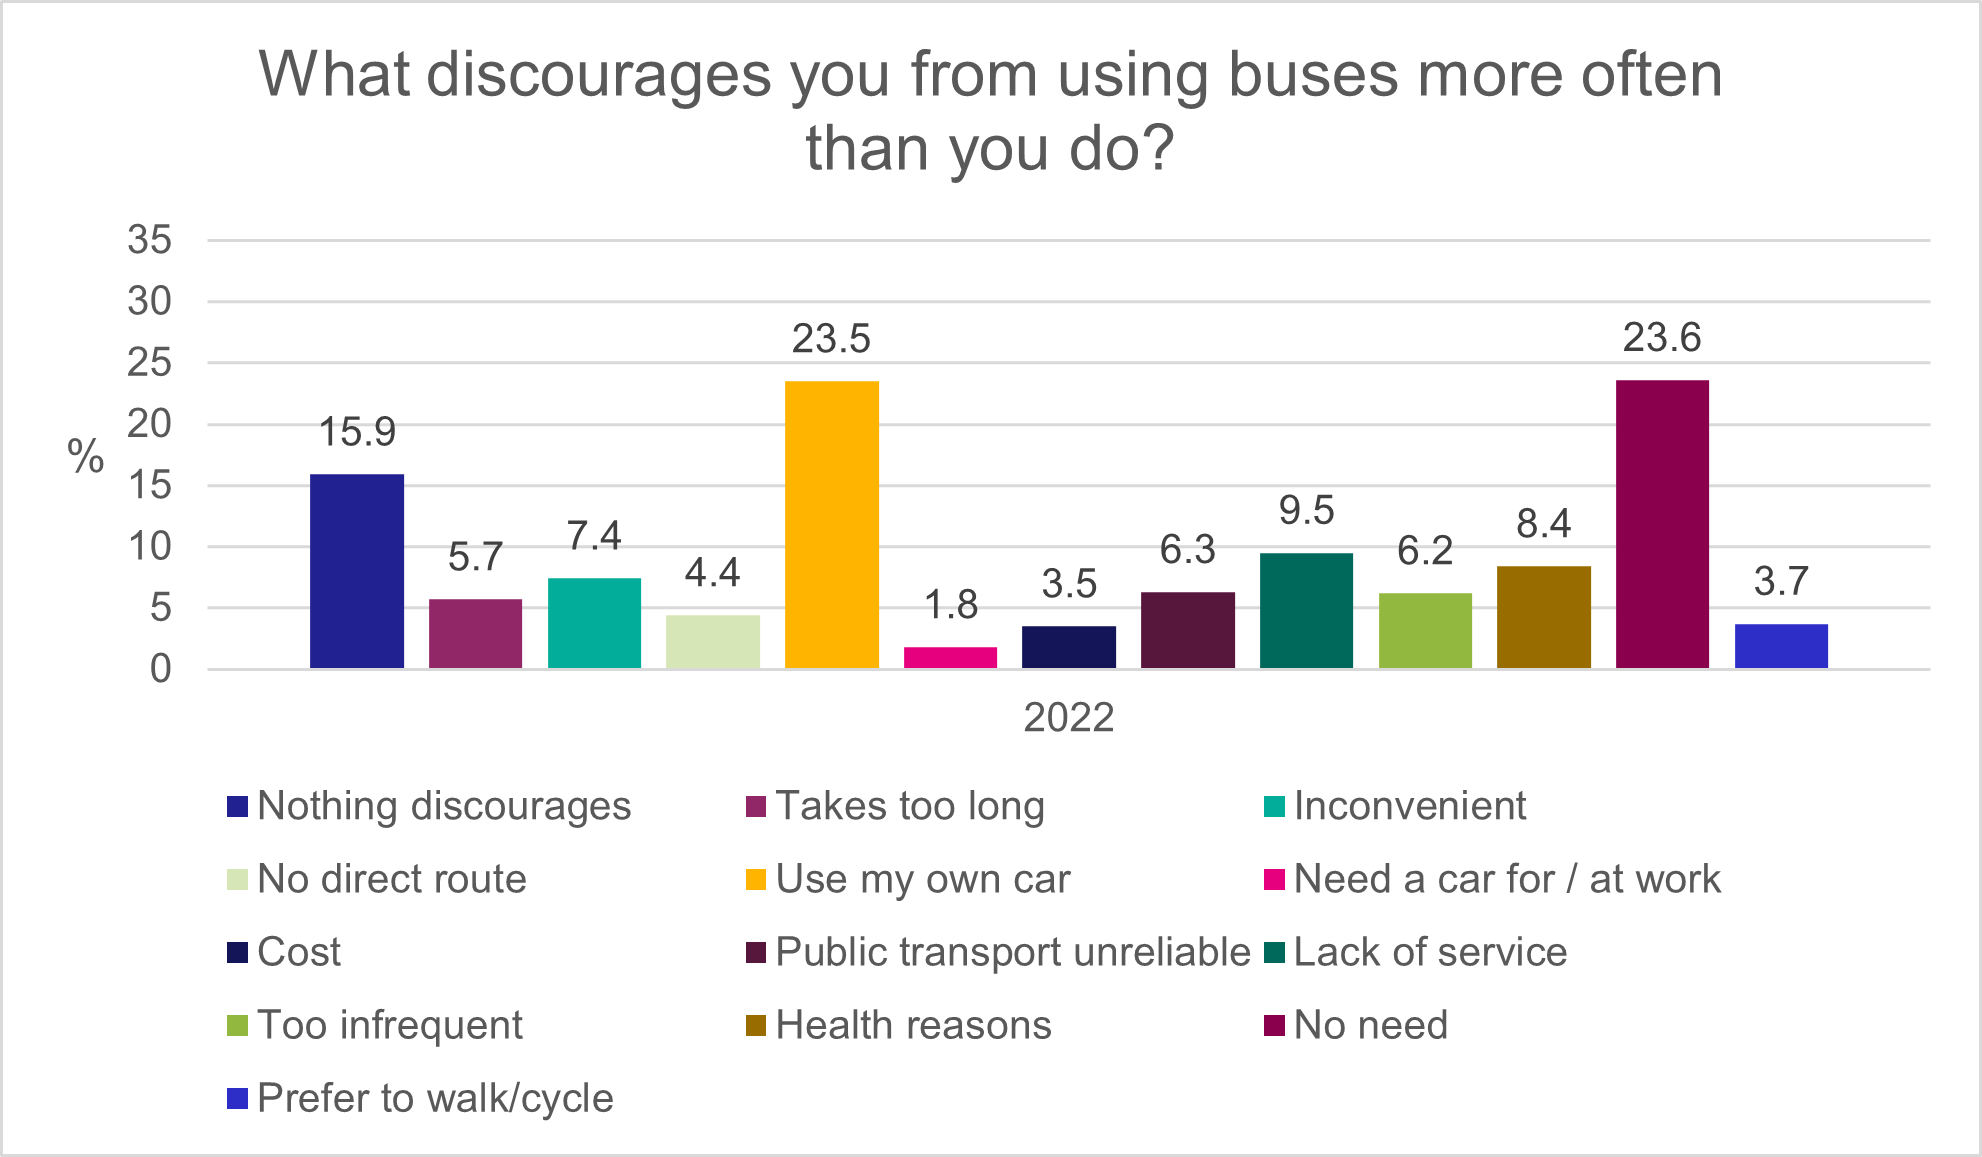
The latest data for this indicator comes from the 2022 Scottish Household Survey. The data indicates that ‘use my own car’ is the most common reported reason for infrequent bus users not using the bus more often, at 24% (26% 2018; 23% 2020).
The reasons ‘no need’ and ‘nothing discourages’ were chosen by 24% (20% 2018; 28% 2020) and 16% (13% 2018; 15% 2020) respectively.
The reasons ‘inconvenient’ and ‘takes too long’ were reported by 7% (10% 2018; 5% 2020) and 6% (10% 2018; 7% 2020) respectively, while ‘cost’ was a barrier for 4% of respondents (7% 2018; 5% 2020).
As a barrier, health reasons were more common among older age groups and less common among younger ones. They were least common, at 1%, among those aged 16-19. By comparison they were reported by 12% of those aged 60-69 and 32% of those over 80. This barrier was more common among those in the lowest 30% of incomes (17%) compared to the highest 30% of incomes (3%). In addition, health reasons were reported as a barrier by 27% of disabled people compared to 2% of those who were not disabled.
The barrier ‘Lack of service’ varied by location, with 24% of those in rural areas saying this relative to 6% of those in urban areas. This was also the case for the barrier ‘Too infrequent’, which was reported by 13% of those in rural areas, compared to 4% of those in urban areas.
Figure six below shows the main reasons that discourage people from using bus more than they do.
Barriers to Train Use
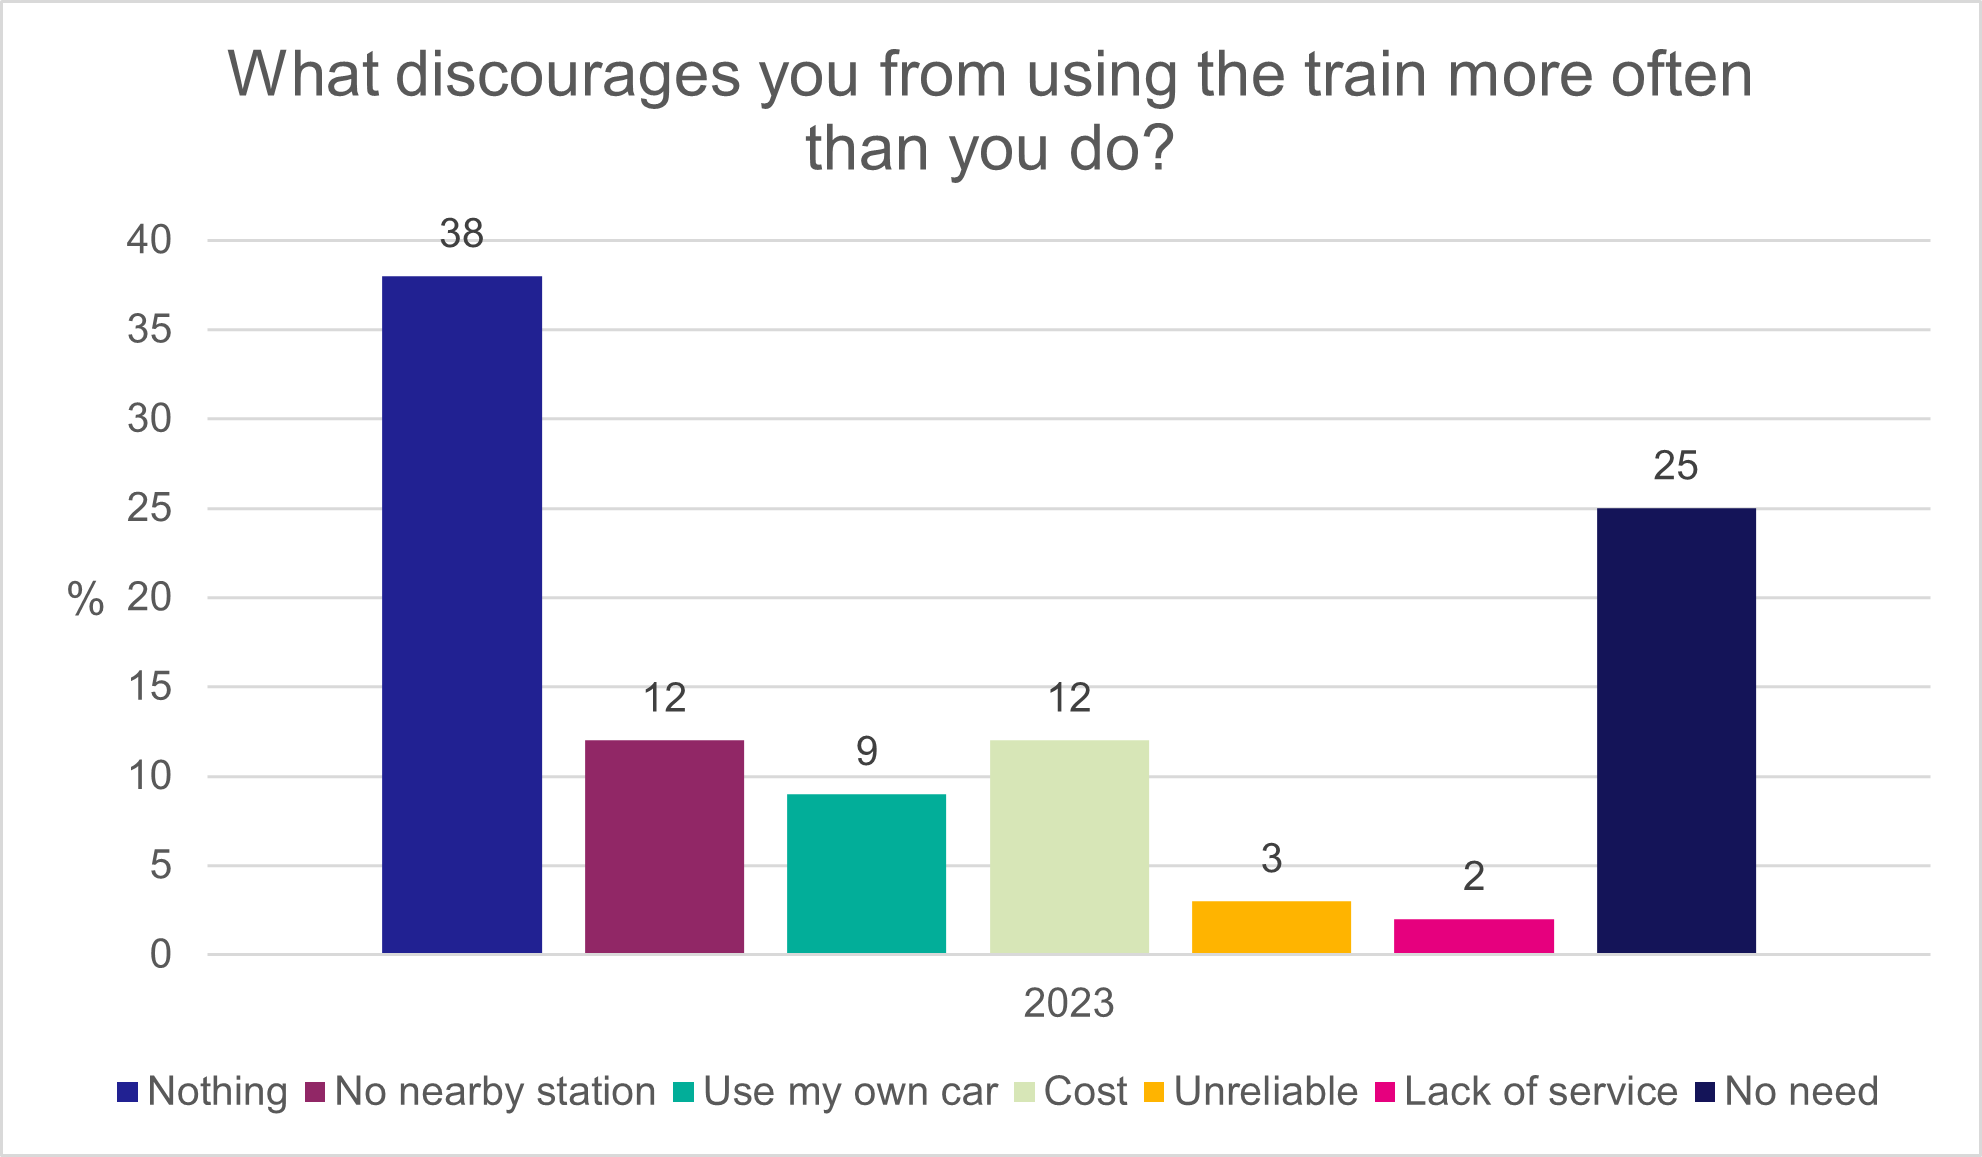
Amongst infrequent users of train, the main identifiable factor which discouraged them from using the train more often was ‘no need’ (25% in 2023; 20% in 2019; 15% in 2016).
In 2023, 12% reported ‘no nearby station’ as a discouraging factor (13% in 2019; 8% in 2016), 12% cited costs (15% in 2019; 11% and 2016) and 9% said ‘use my own car’ (5% in both 2019; 3% in 2016).
A significant proportion of infrequent train user said that ‘nothing’ discouraged them from using it (38% in 2023; 37% in 2019; 54% in 2016).
Amongst those that had not used the train in the past month, health reasons were more commonly cited as a barrier among older age groups and were less common among younger ones. They were least common, at 1%, among those aged 20-29. By comparison they were reported by 8% of those aged 70-69 and 16% of those over 80. This barrier was more common among those in the lowest 30% of incomes (8%) compared to the highest 30% of incomes (1%). In addition, health reasons were reported as a barrier by 13% of disabled people compared to 1% of those who were not disabled.
Figure seven below shows the main reasons that discourage people from using train more than they do.
Costs and Affordability
Average weekly household expenditure in Scotland on transport and vehicles in 2020-22 was £69.20, representing 14.5% of total household expenditure. On average, £28.50 was spent on the purchase of vehicles, £25.80 on the operation of personal transport (including £16.60 on petrol, diesel and other motor oils) and £14.80 on transport services (such as bus and train fares)
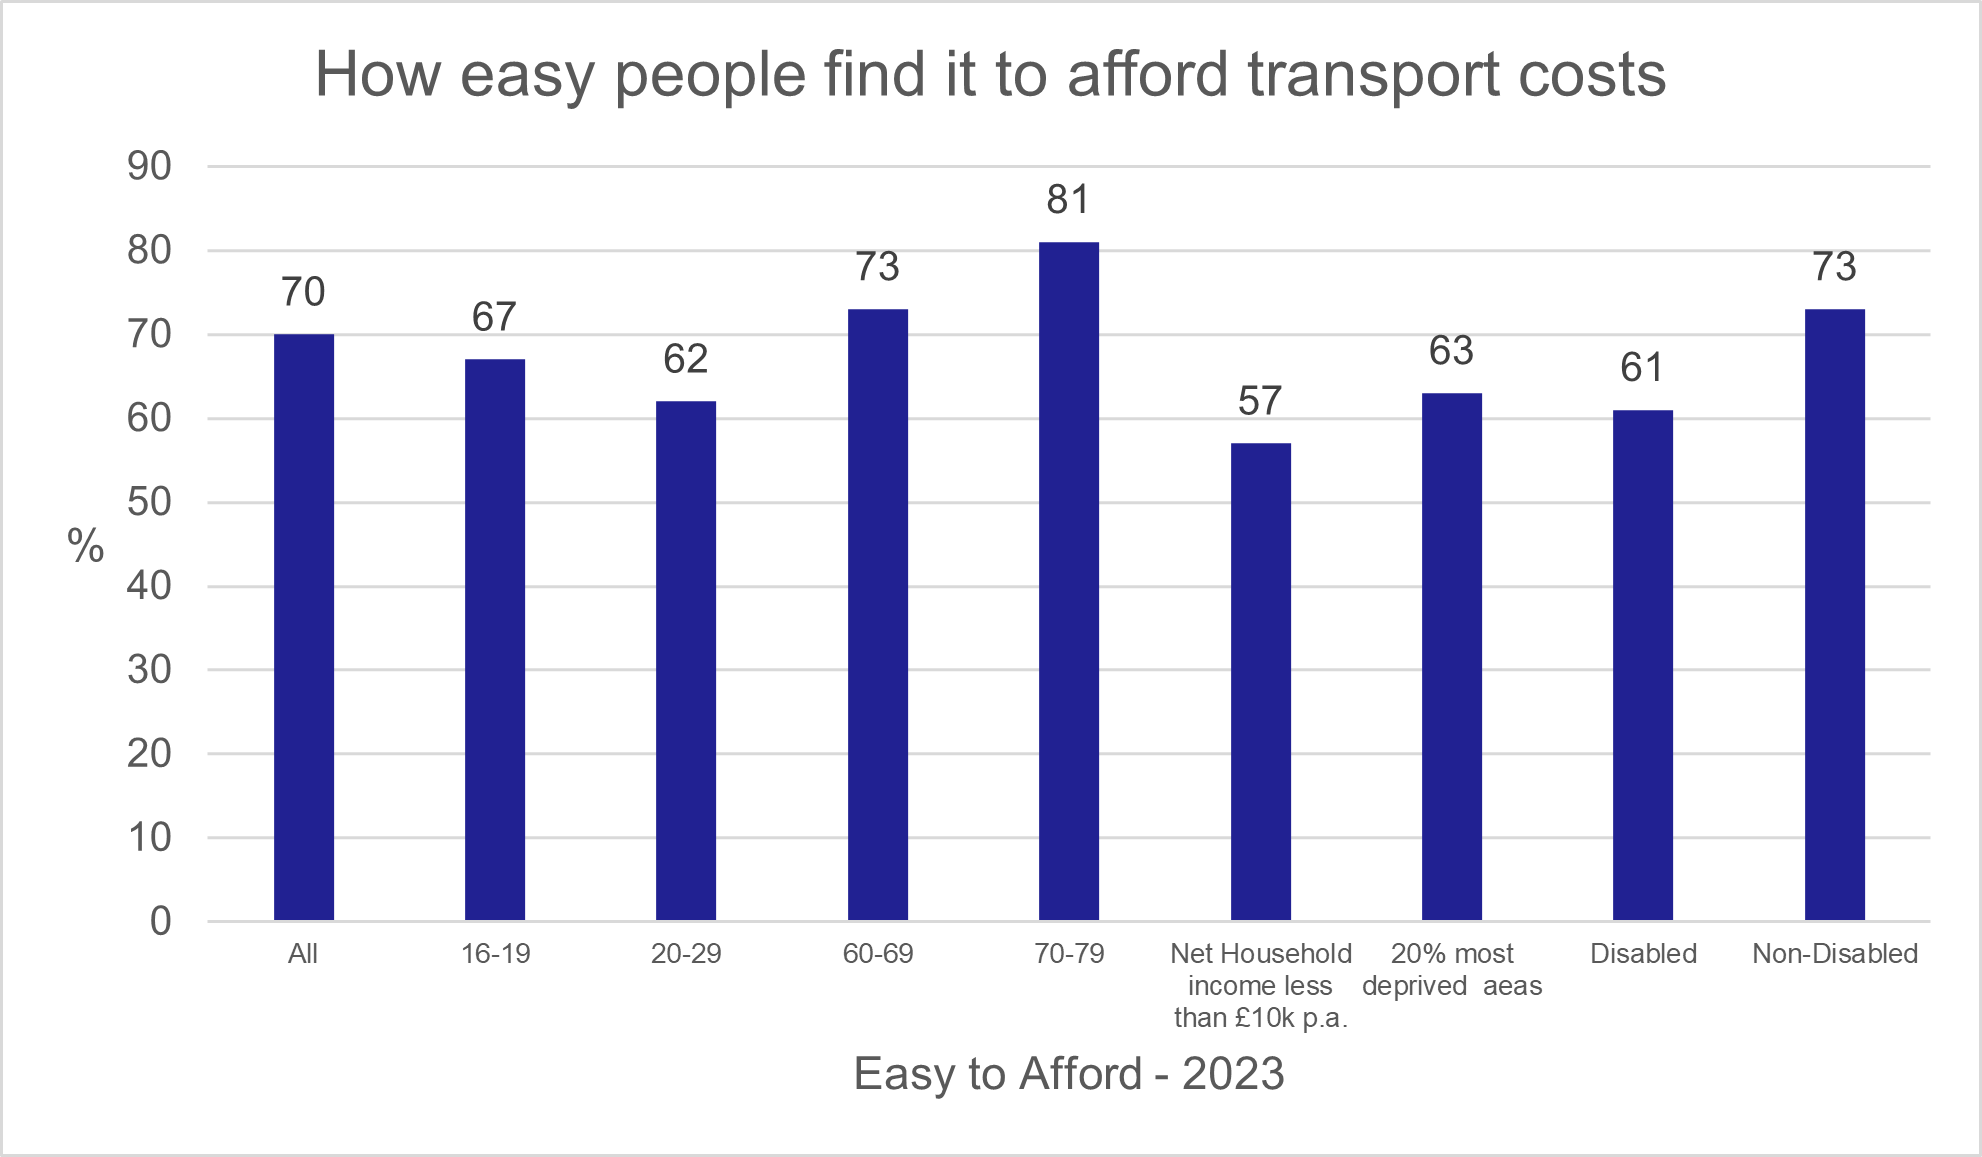
70% of people said their transport costs were either fairly easy or very easy to afford. Though data for this indicator was not collected in 2019, comparison with 2022 data (64%) shows a six-percentage point increase. Those in households on incomes up to £10,000 were less likely to consider their costs affordable (57%).
Those aged 60 and over were more likely to consider their costs affordable. Sixty-seven per cent of those aged 16-19 and 62% of those aged 20-29 said their costs were affordable. Disabled people (61%) were less likely than non-disabled people (73%) to consider their costs affordable. Those in large urban areas (63%) were less likely to consider their costs affordable.
54% of respondents said that transport costs affected the method of travel they used. This is an increase on the 2022 figure (48%).
Users and non-users of public transport were similarly likely to view transport costs as affordable. Sixty-eight per cent of people who used public transport in the past month viewed public transport as affordable, compared with 71% of those that had not used public transport.
Sixty-nine per cent of bus users and 73% of rail users viewed transport costs as affordable.
The Scottish Household Survey also asked users of bus and rail services whether they agreed with a number of statements about their services. Regarding rail, 52% agreed that ‘train fares are good value’. This was a non-statistically significant increase in agreement compared with 2019 (48%). Note that fieldwork period for the survey continued until February 2024 when the ScotRail Peak Fares Removal Pilot was in operation.
For bus, the percentage of users agreeing that bus fares were good value increased between 2019 and 2023 from (55% to 62%).Transport Focus, an independent watchdog for transport users, also asks bus users in Scotland about value for money with the most recent figures (2023) showing that 68% were satisfied with this.
Figure eight below shows how easy people find it to afford transport costs broken down by demographic and socioeconomic characteristics.
Case Study: Young Person’s Free Bus Travel Scheme – Year One Evaluation
The Young Persons’ Free Bus Travel Scheme (also known as the Under 22s scheme) commenced on 31 January 2022. All children and young people aged 5-21 resident in Scotland (including asylum seekers and refugees) are eligible to apply.
The policy aims of the scheme are to encourage more sustainable travel behaviours and tackle issues related to transport poverty and access to services by: embedding positive sustainable travel behaviours; opening up social, education, employment and leisure opportunities; and reducing household outgoings to aid children, particularly those living in poverty.
Transport Scotland published an evaluation report one year on from the launch of the scheme. Though at an early stage of the scheme’s implementation, there is already evidence that increasing numbers of young people are travelling by bus across a wide range of journey purposes because of the scheme. There is also some limited early evidence of modal shift away from car use to buses, with young people using the bus both to make journeys they would have made anyway as well as a large volume of new/additional journeys.
The evaluation also reports clear evidence that the scheme had opened up new and additional opportunities and had supported ongoing engagement or more frequent access to existing opportunities and activities.
The scheme was also felt to have provided equal travel access to opportunities by removing the transport cost barrier. The evaluation reported that there was significant evidence that the scheme had positively impacted travel costs. Cost savings and removing the cost barrier was also one of the main benefits identified as a result of the scheme noted by all.
The evaluation concluded that the evidence showed not only are the short- and medium-term outcomes of the scheme being achieved, but also that some of the long-term outcomes were already being progressed.
The Scheme will be evaluated again in 2025, three years on from implementation.