Takes Climate Action
Transport Emissions
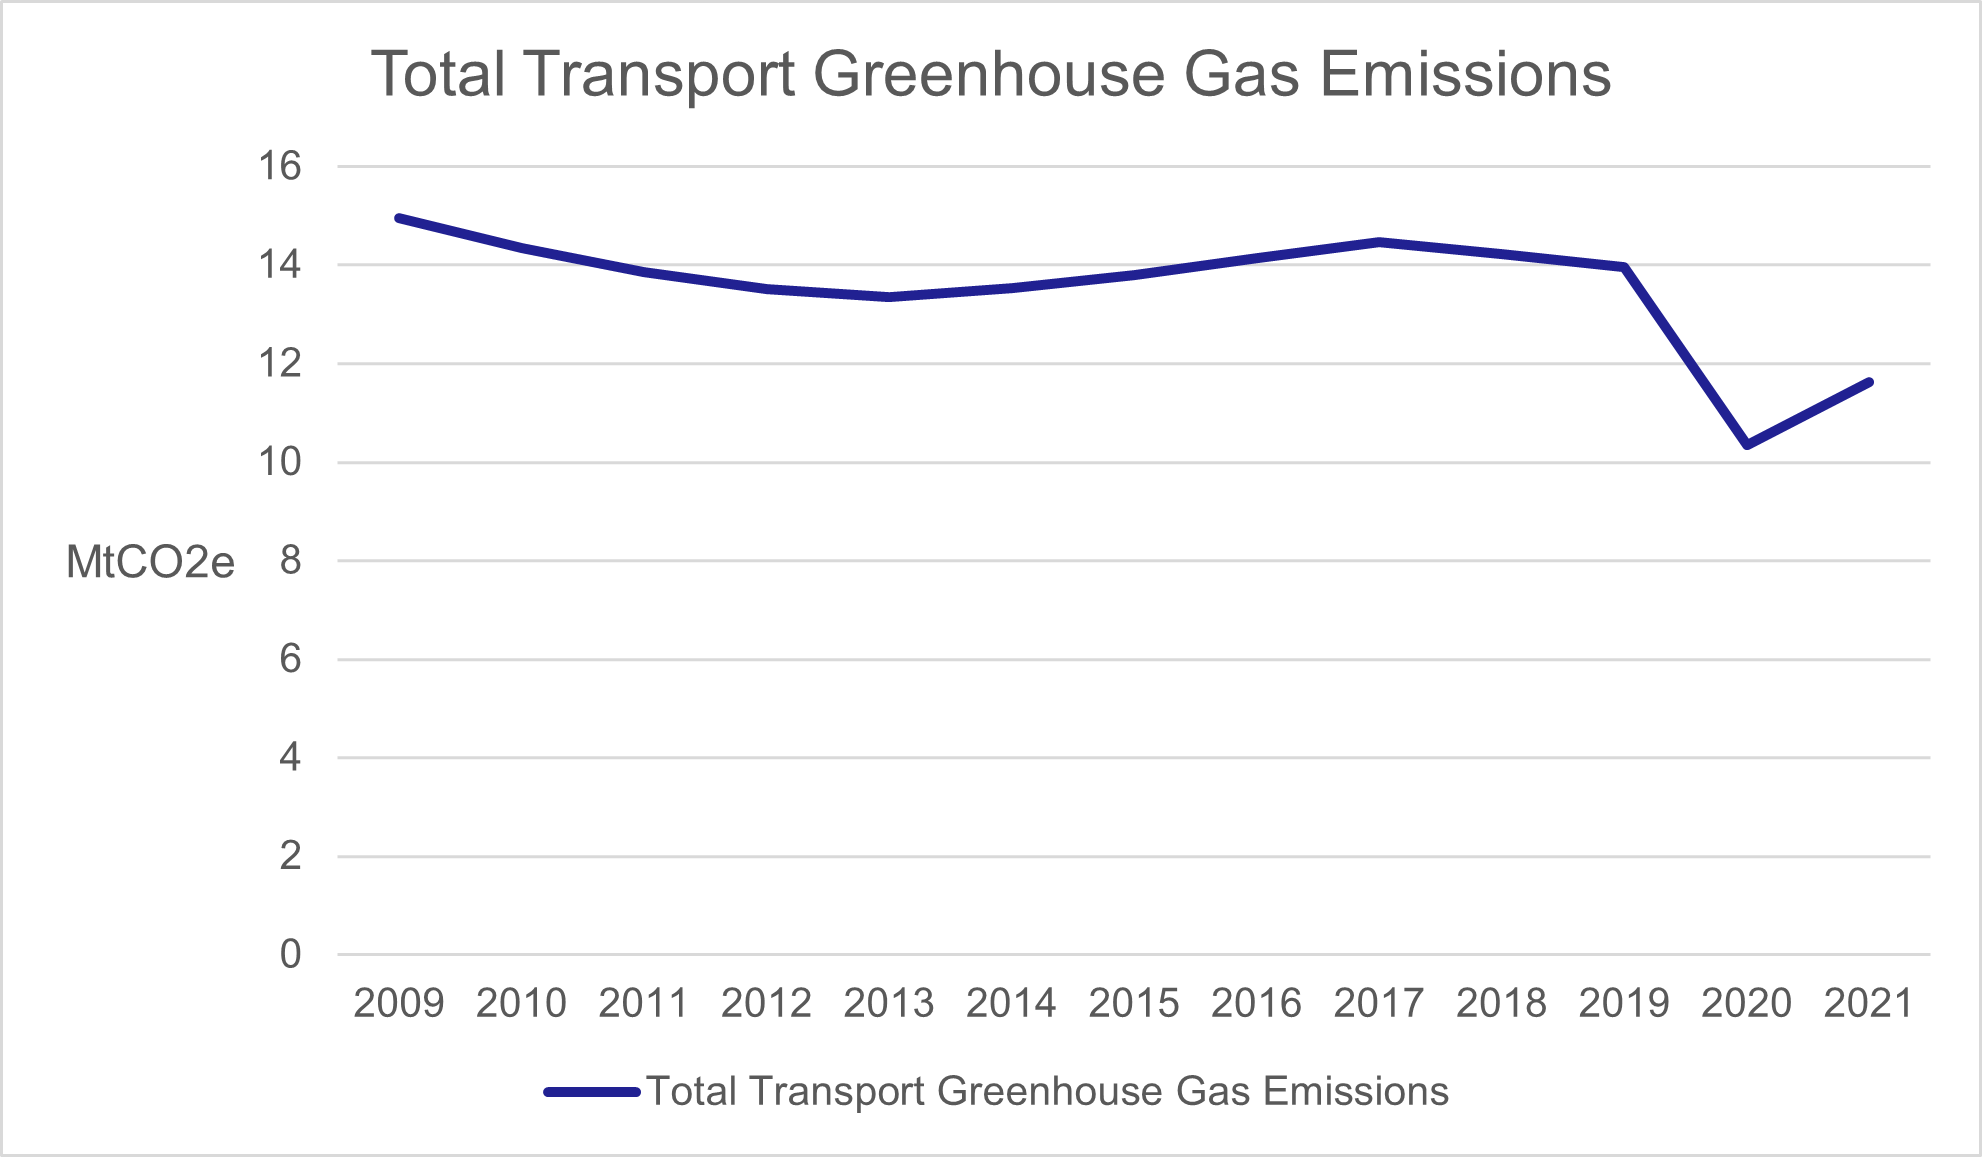
Transport emissions have fallen from 14.88 mt of CO2e in 1990 to 11.6 mt in 2021, although there have been fluctuations in overall emissions since 1990.
Since 2017, transport emissions have declined year on year, though rose in 2021 following historic low-level recorded in 2020 as a result of the COVID-19 pandemic.
Figure nine below shows transport greenhouse gas emissions from 2009 to 2021.
In 2021, cars represented 41% of the total of transport emissions, followed by Heavy Goods Vehicles (HGVs) (16%). Lights Good Vehicles (LGVs) and domestic shipping each contributed 15% of overall emissions. In the context of transport, overall road transport accounts for 75% of emissions.
Sustainable Mode Share
In 2023, 35% of journeys were made using sustainable modes. Other modes, by contrast, were used in 65% of journeys.
By journey length, 73% of journeys under 1 km were made by sustainable modes, while 51% of journeys between 1 km and 2 km were made in this way. By comparison, 20% of journeys between 5 km and 10 km were made sustainably while 11% of journeys over 40 km were made in this way.
The median journey length in 2023 was 4.0 km, as reported in Transport and Travel in Scotland, 2023 using data from the Scottish Household Survey. Overall, most journeys are short, with 17% of journeys under 1 km and 55% under 5 km.
Under two miles, 56% of journeys were made using sustainable modes.
The percentage of sustainable journeys varied by group. For those in urban areas, 56% of journeys under two miles were sustainable, compared to 53% of these journeys in rural areas. Sustainable journeys are also more common among younger people, with 77% of the journeys of those aged 16-19 and 66% of the journeys of those aged 20-29 being made in this way. By comparison, 54% of journeys under two miles among those aged 50-59 were made using sustainable modes.
Journey modes also varied by income, with those in the lowest 30% of incomes making 65% of these journeys by sustainable modes, compared to 48% of these journeys made by those in the highest 30% of incomes.
Under five miles, 46% of journeys were made using sustainable modes.
The percentage of sustainable journeys varied by group. For those in urban areas, 46% of journeys under five miles were sustainable, compared to 37% of journeys of this length in rural areas. Sustainable journeys are also more common among younger people, with 75% of the journeys made by those aged 16-19 and 55% of the journeys among those aged 20-29 being made in this way. Among those aged 40-49 , 40% of these journeys were sustainable. Journey modes also varied by income, with those in the lowest 30% of incomes making 57% of their journeys under five miles in this way, compared to 38% of the journeys made by those in the highest 30% of incomes.
Ultra Low Emission Vehicles (ULEVS)
As reported in Scottish Transport Statistics, ULEVs are vehicles that emit less than 75g of CO2 per kilometre. This compares to average petrol cars emissions of 168g of CO2 per kilometre and 103g for buses. The data for this section comes from data provided to the Scottish Government by the Department for Transport.
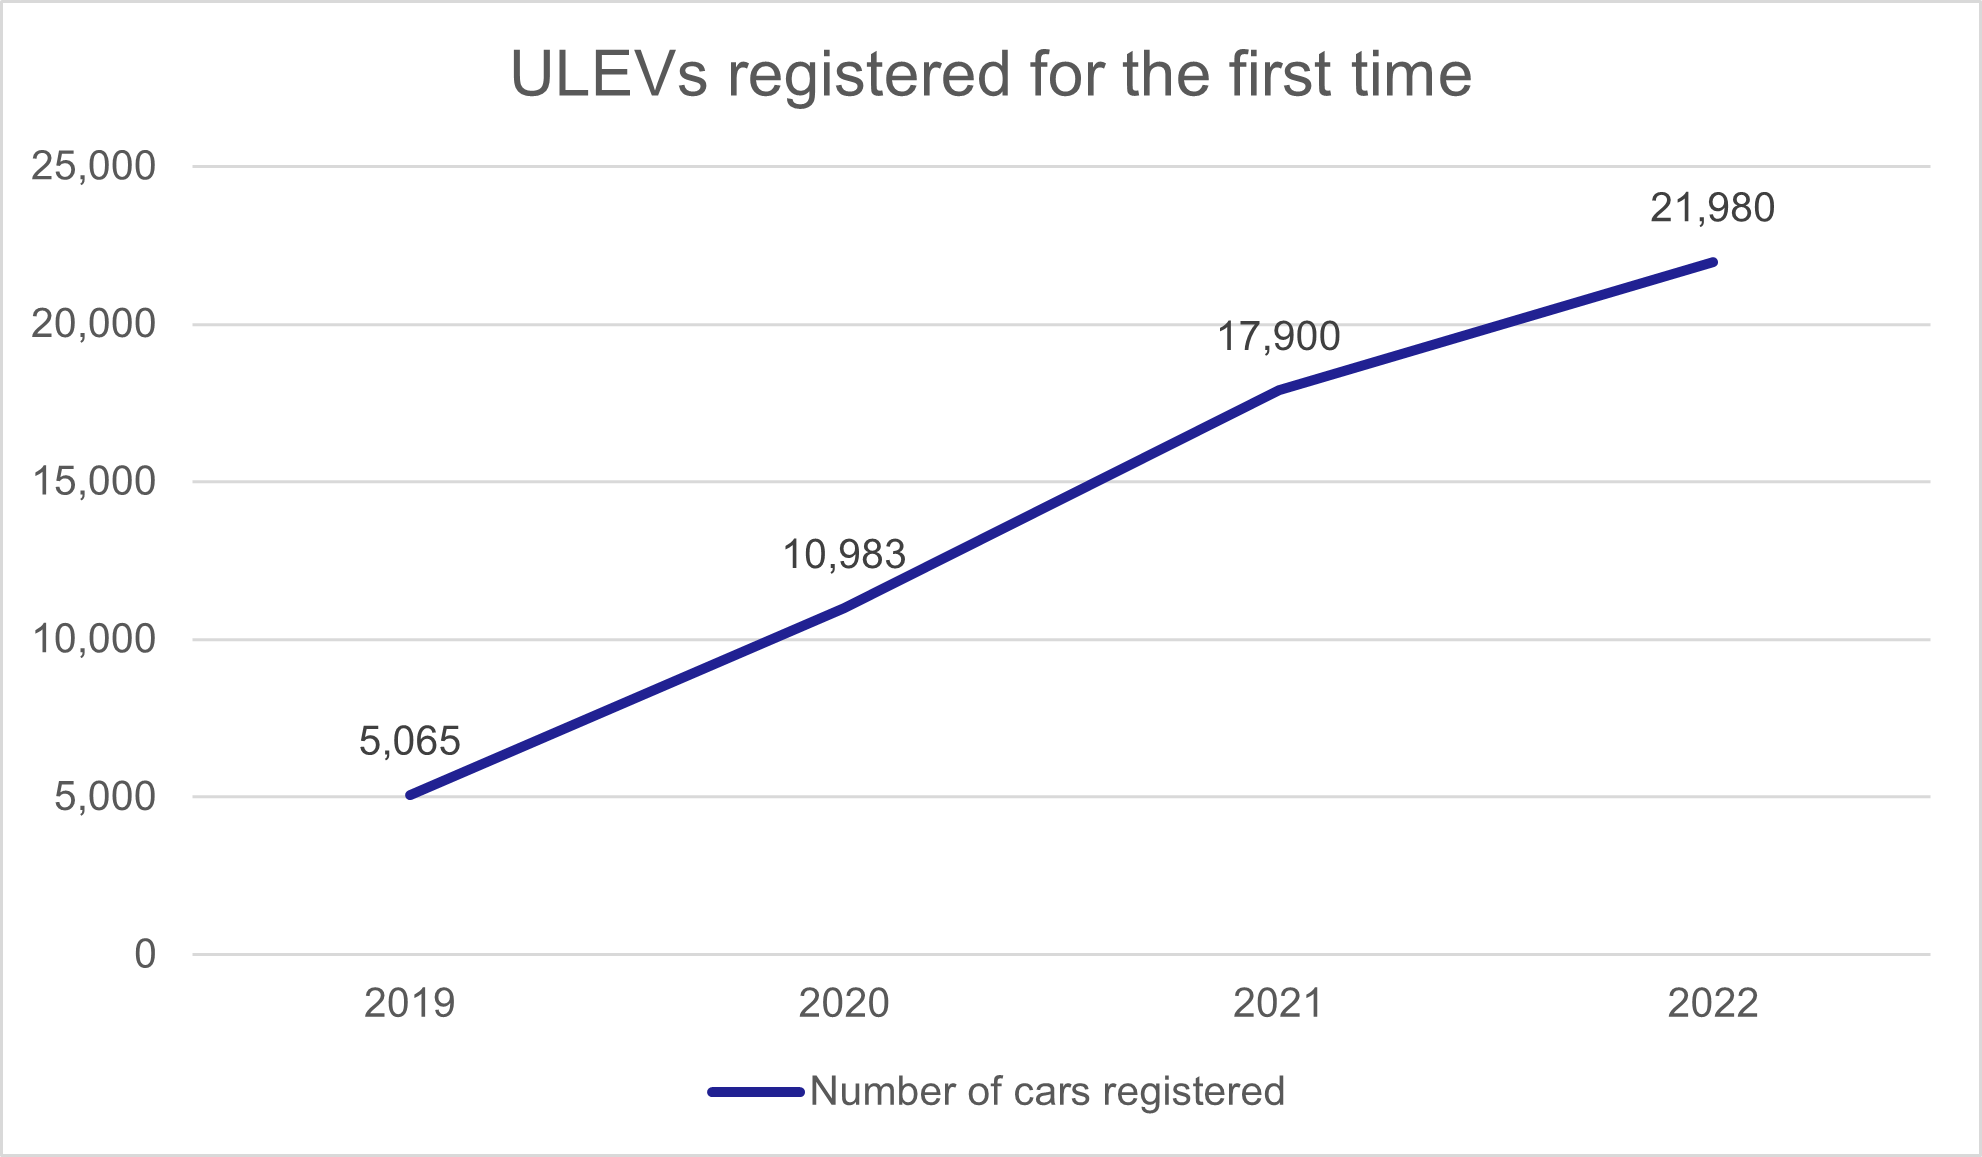
The number of ultra-low emission vehicles registered in Scotland for the first time in 2022 was 21,980, 23% up on the corresponding figure for 2021 (17,900) and over 300% higher than the baseline figure of 2019 (5,066). At the end of 2022 there were 64,447 ULEVs registered in Scotland.
Figure 10 below shows the number of ultra-low emission vehicles registered for the first time in Scotland from 2019 to 2022.
Satisfaction with Public Transport
Overall, satisfaction with public transport was lower in 2023 than in 2019.
The proportion of all survey respondents stating that they were very or fairly satisfied with public transport in 2023 was 64%, a four-percentage point drop from 2019 (68%). Satisfaction with public transport was higher amongst actual users of public transport (those that had used bus or train in the past month) with 74% of users reporting that they were satisfied in 2023. This is similar to levels of satisfaction recorded in 2019 (76%). When looking specifically at bus and train users, 77% of bus users and 71% of train users reported that they were satisfied with public transport.
Satisfaction with public transport was lowest in rural areas. Satisfaction rates for those living in remote rural and accessible rural areas (47% and 46% respectively) contrasted with a satisfaction rate of 72% for those living in large urban areas.