Casualty Reduction Targets: Scotland’s Road Safety Framework to 2030
Casualty Reduction Targets: Scotland’s Road Safety Framework to 2030
Introduction
Transport Scotland has published a Road Safety Framework to 2030 The following section provides information on the progress made towards the four main casualty reduction targets outlined in the framework. Each reduction target is assessed against a baseline of the 2014-2018 average.
| Target | 2030 target % reduction |
|---|---|
| People killed | 50% |
| People seriously injured | 50% |
| Children (aged < 16) killed | 60% |
| Children (aged < 16) seriously injured | 60% |
As outlined previously, the number of serious and slight casualties cannot be directly compared to previously recorded figures due to changes in severity reporting.
Progress against the serious casualty reduction targets are therefore based on adjusted figures.
To illustrate the reductions necessary the following table shows the 2014 to 2018 baseline, the latest position, as well as the level of casualties inferred by the 2030 targets.
| 2014-2018 average | 2023 | 2030 target | |
|---|---|---|---|
| People killed | 174 | 155 | 87 |
| People seriously injured | 2,728 | 1,944 | 1,364 |
| Children (aged < 16) killed (3 year average) | 6 | 4 | 3 |
| Children (aged < 16) seriously injured | 259 | 178 | 155 |
Charts showing performance are presented in figure 8. More detail about the calculation of these indicative lines is included in the methodology of assessment section.
Summary of Progress
The 2023 figures show:
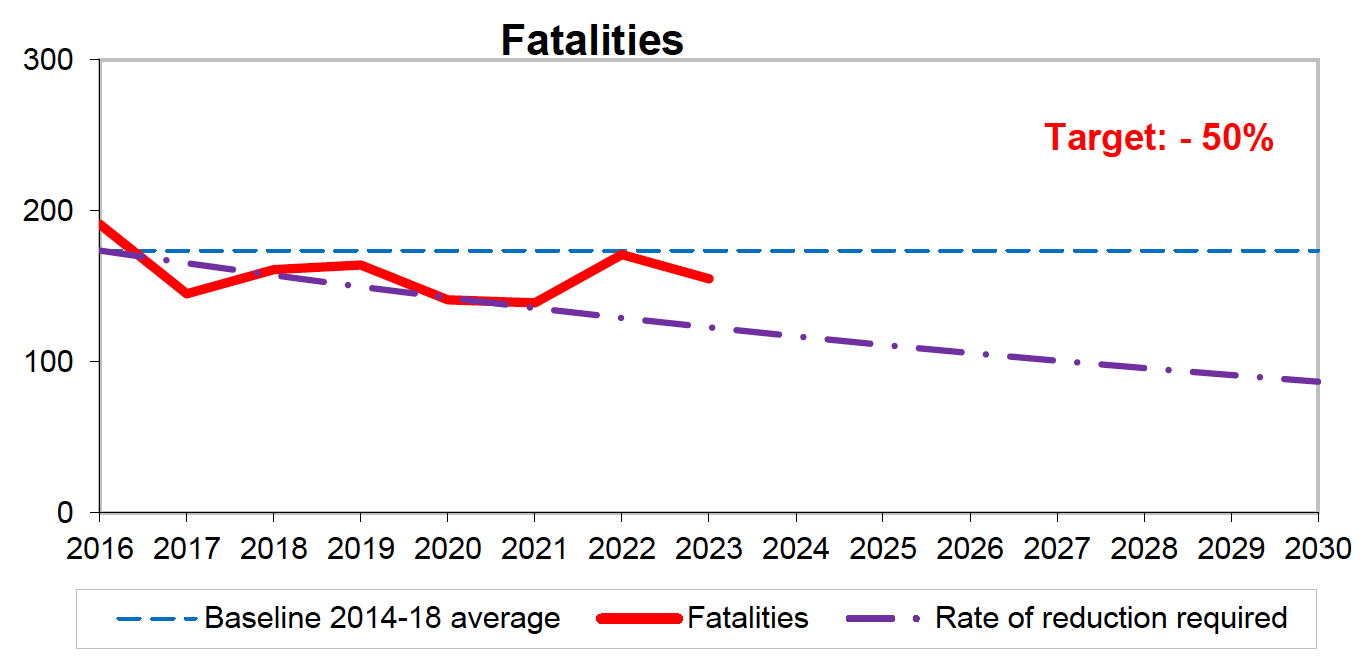
- 155 people were reported as killed in 2023, 11 per cent (19) below the 2014-2018 average of 174.
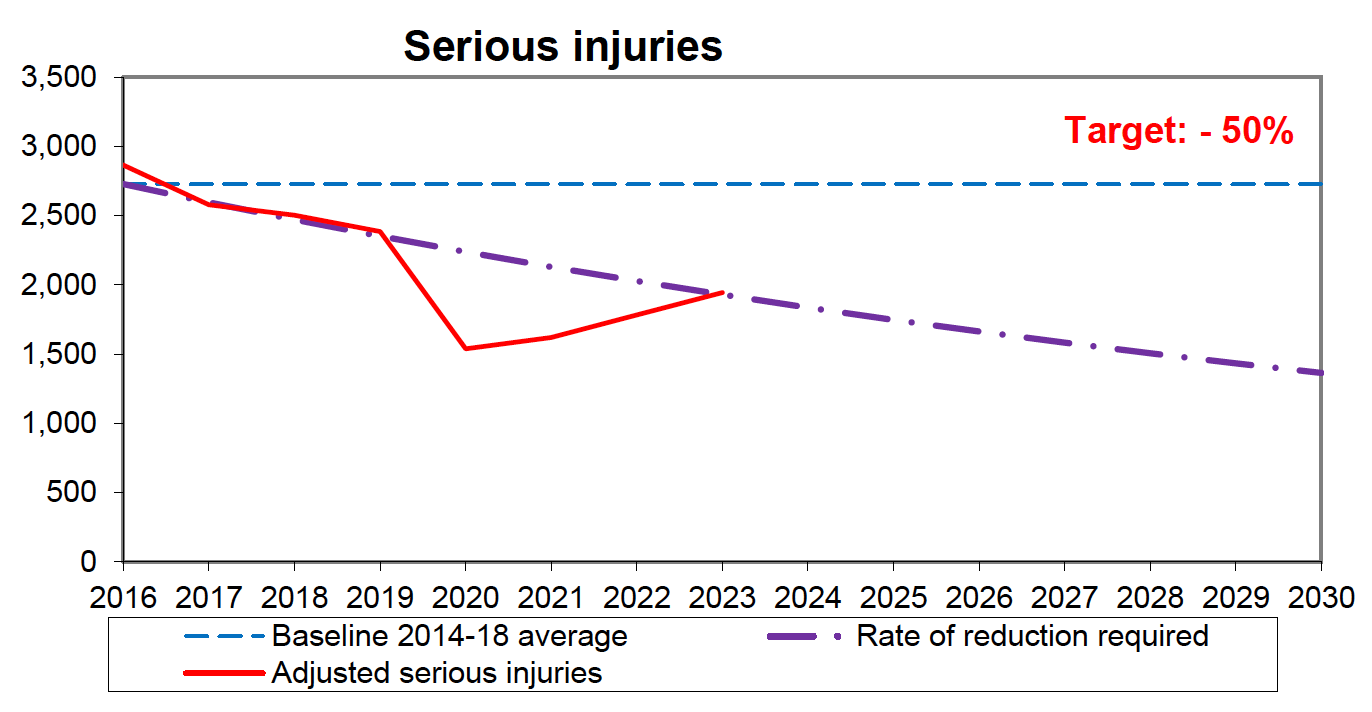
- 1,944 people were reported as seriously injured in 2023, 29 per cent (784) below the 2014-2018 average of 2,728.
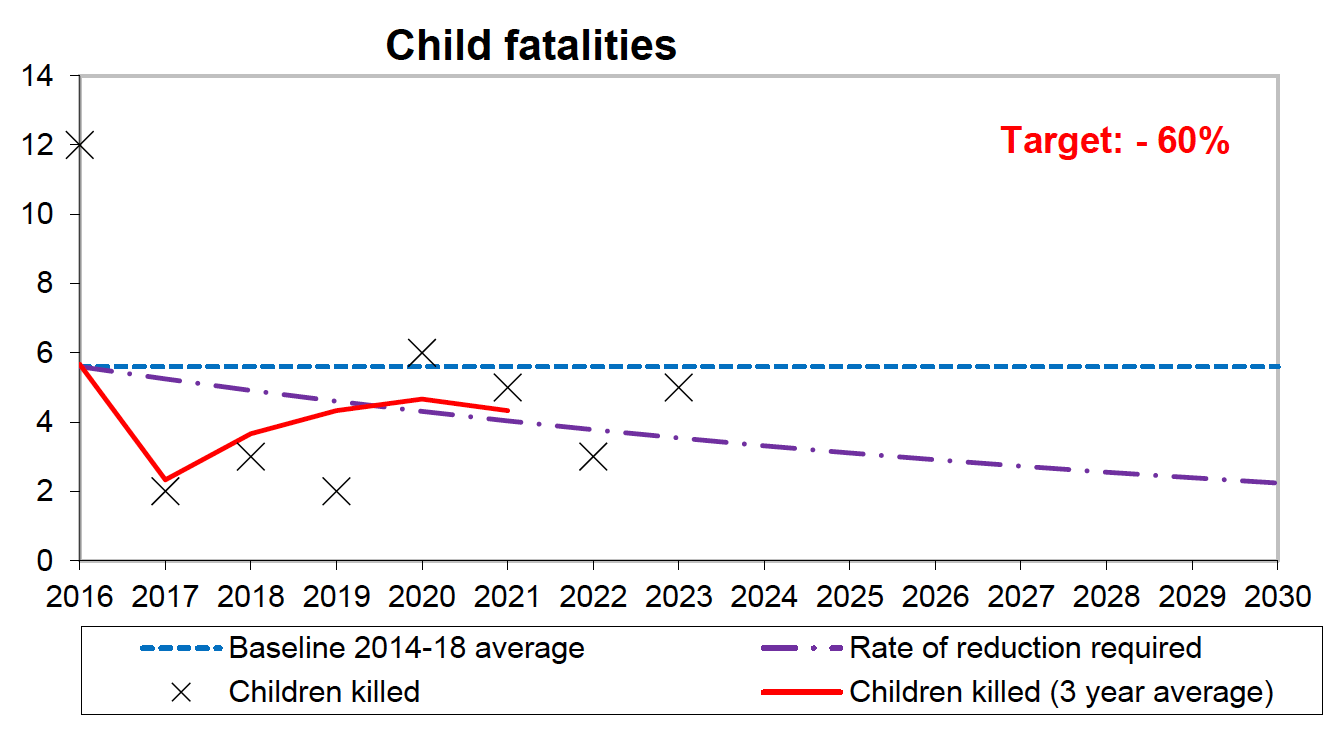
- 5 children were reported as killed in 2023, meaning the average for the 2021-2023 period was 4 a year, this is 23 per cent (2) below the 2014-2018 average of 6.
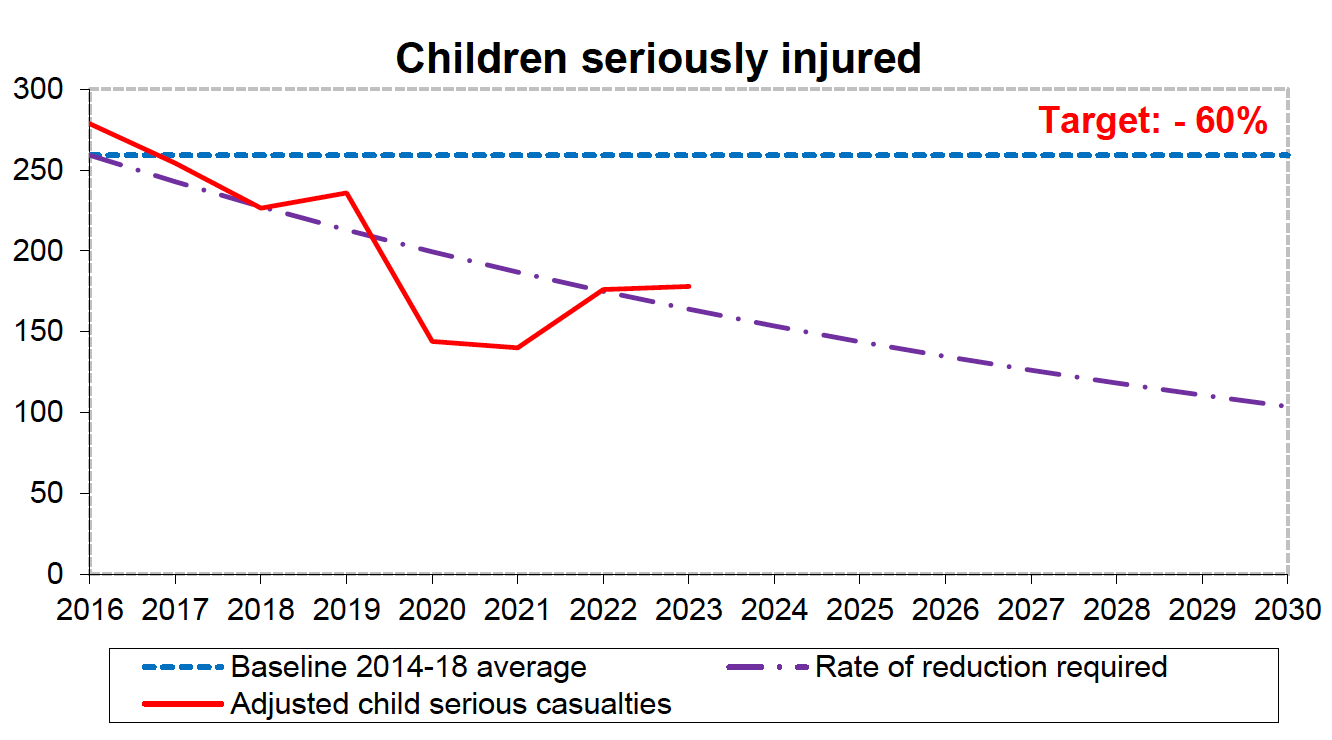
- 178 children were reported as seriously injured in 2023, 31 per cent (81) below the 2014-2018 average of 259.
Figure 8 shows progress towards the casualty reduction targets for 2023.
Commentary
Numbers killed
There were 155 people killed in 2023, an 11% reduction from the 2014-18 baseline average.
Figure 8(A) shows that this reduction is not on track to meet to meet the framework target for 2030 (a reduction of 50% from 2014-18 baseline).
Numbers Seriously Injured
There were 1,944 serious injuries in 2023, a 29% reduction since the 2014-18 baseline level.
Figure 8(B) shows that this reduction is not on track to meet the framework target for 2030 (a reduction of 50% from 2014-18 baseline).
Children killed
Due to the relatively small numbers involved and the impact of year-to-year fluctuations this target is measured using a three-year average. An average of 4 children a year were killed in the 2021-2023 period, a 23% reduction from the 2014-2018 baseline.
Figure 8(C) shows that this reduction is not on track to meet the framework target for 2030 (a reduction of 60% from 2014-18 baseline).
Children seriously injured
There were 178 child serious injuries in 2023, a 33% reduction since the adjusted 2014-18 baseline level.
Figure 8(D) shows that the reduction is not currently on track to meet the framework target for 2030 (a reduction of 60% from 2014-18 baseline).
Other statistics for monitoring progress
Table 40 shows the baseline figures for each local authority area relating to the targets for the numbers killed (separately for trunk roads, local authority roads and all roads), along with the corresponding figures for each of the past ten years and the latest five years’ averages. Table 42 shows figures for each Police Force division related to all killed and children killed.
Method for assessing progress towards the casualty reduction targets
One way of assessing progress towards the targets is to compare actual casualty numbers in each year with an indicative line that starts at the baseline figure in 2016 (mid-point of the 2014 to 2018 average) and falls, by a constant percentage reduction in each subsequent year, to the target for 2030. Other approaches could have been used: there are many ways of producing lines that indicate how casualty numbers might fall fairly steadily to the targets for 2030.
The method adopted to produce the indicative target lines shown in Figure 8 involves a constant percentage reduction in each year after 2016 to 2030. The resulting indicative target lines represent the percentages of the baseline averages which are shown in the table below. They are not straight lines, because of the compounding over the years effect of constant annual percentage reductions (to two decimal places, the falls are: 4.83% per annum for both killed and serious to meet the 2030 target. For both children killed and seriously injured casualties the fall is 6.34%.
| Killed and Serious (50% reduction) | Child killed and serious (60% reduction) | |||
|---|---|---|---|---|
| % baseline (milestone from 2016) | % reduction from baseline (milestone) | % baseline (milestone from 2016) | % reduction from baseline (milestone) | |
| 2016 | 100% | 100% | ||
| 2017 | 95.17% | 4.83% | 93.66% | 6.34% |
| 2018 | 90.57% | 9.43% | 87.73% | 12.27% |
| 2019 | 86.20% | 13.80% | 82.17% | 17.83% |
| 2020 | 82.03% | 17.97% | 76.97% | 23.03% |
| 2021 | 78.07% | 21.93% | 72.09% | 27.91% |
| 2022 | 74.30% | 25.70% | 67.52% | 32.48% |
| 2023 | 70.71% | 29.29% | 63.25% | 36.75% |
| 2024 | 67.30% | 32.70% | 59.24% | 40.76% |
| 2025 | 64.04% | 35.96% | 55.49% | 44.51% |
| 2026 | 60.95% | 39.05% | 51.97% | 48.03% |
| 2027 | 58.01% | 41.99% | 48.68% | 51.32% |
| 2028 | 55.20% | 44.80% | 45.59% | 54.41% |
| 2029 | 52.54% | 47.46% | 42.71% | 57.29% |
| 2030 | 50.00% | 50.00% | 40.00% | 60.00% |
< Previous | Contents | Next >