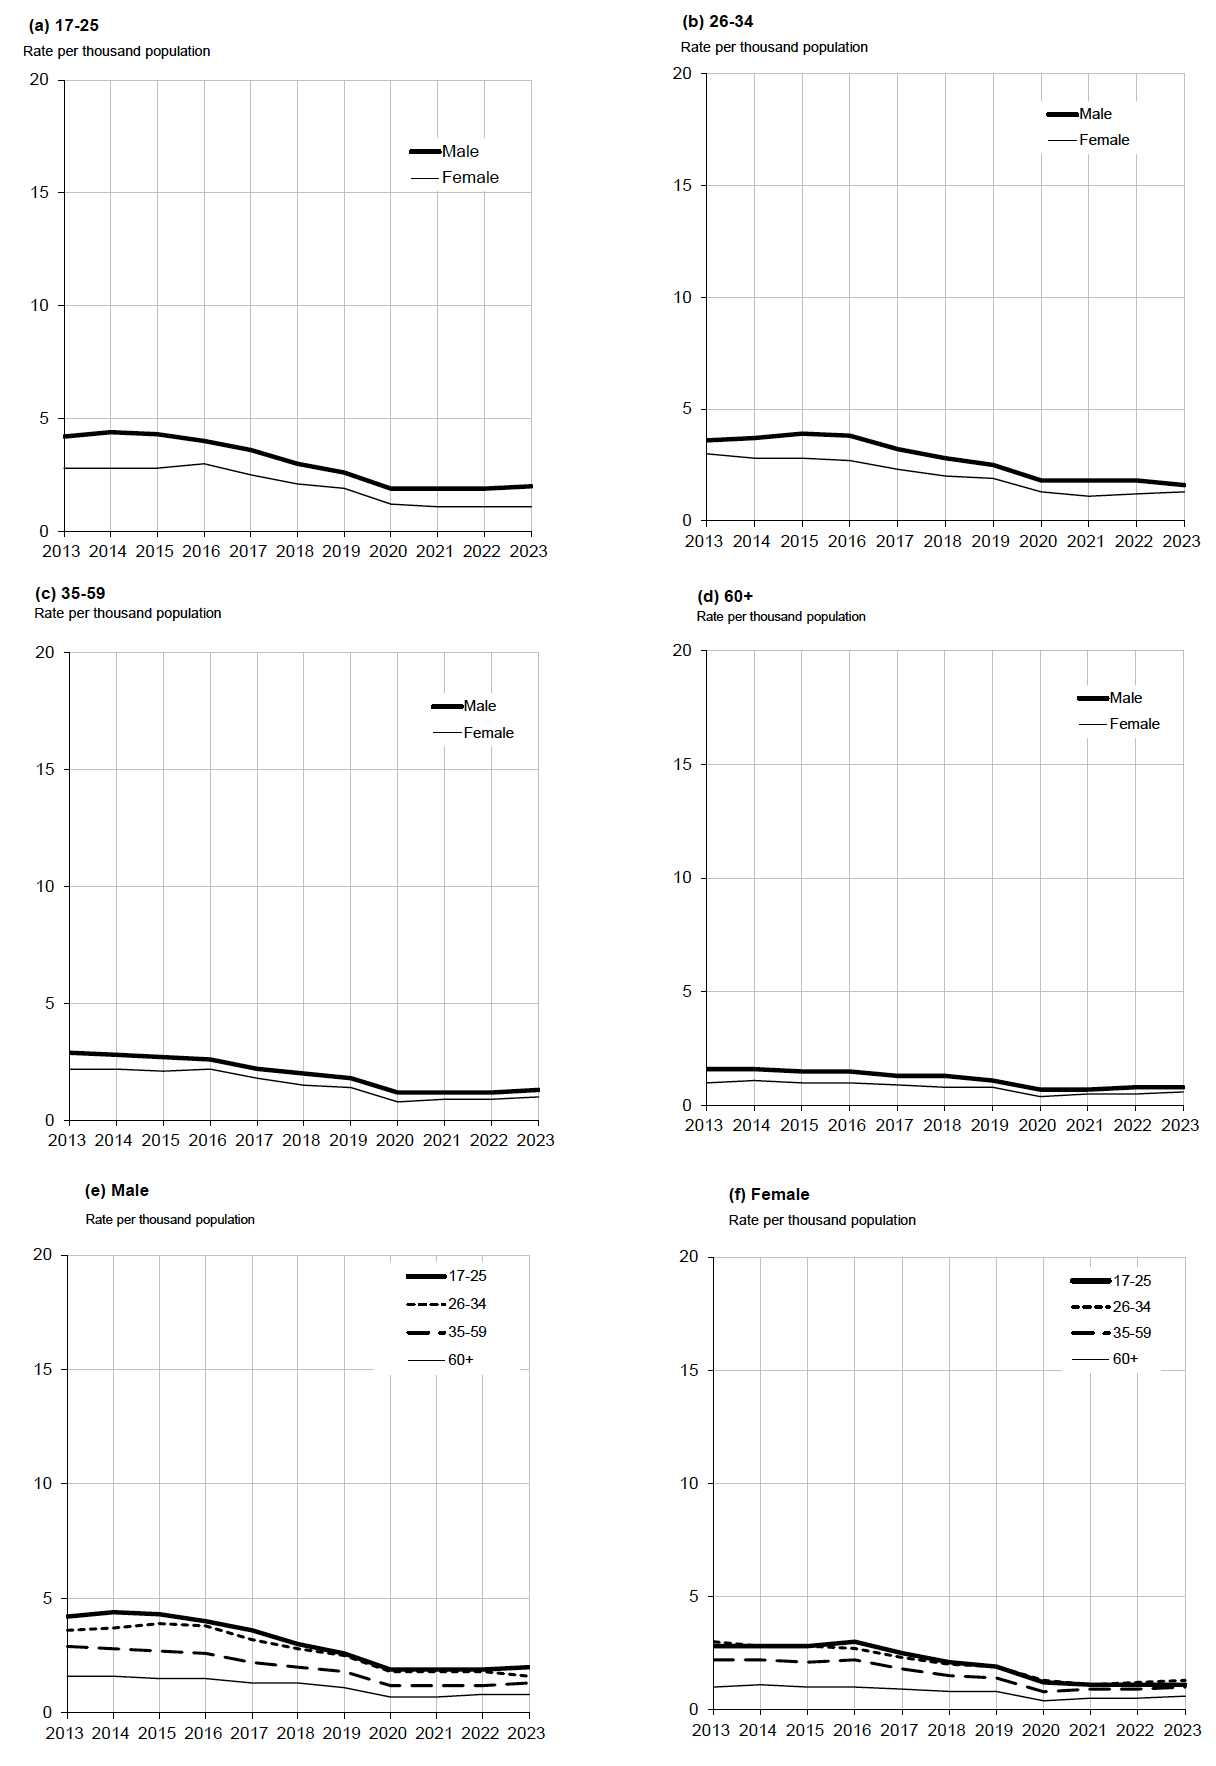
Table 18b: Car drivers involved in reported injury collisions by age and sex 1
Table 18b: Car drivers involved in reported injury collisions by age and sex 1
Years: 2014-18 and 2019-23 ave and 2013 to 2023
Car Drivers
| Year | Numbers | Rates per thousand population5 | |||||||||
|---|---|---|---|---|---|---|---|---|---|---|---|
| 17-25 | 26-34 | 35-59 | 60+ | Total 2 | 17-25 | 26-34 | 35-59 | 60+ | Total 3 | ||
| Male | 2014-18 average | 1,174 | 1,105 | 2,342 | 1,032 | 5,741 | 3.9 | 3.5 | 2.5 | 1.4 | 2.5 |
| 2013 | 1,314 | 1,125 | 2,758 | 1,105 | 6,341 | 4.2 | 3.6 | 2.9 | 1.6 | 2.8 | |
| 2014 | 1,355 | 1,161 | 2,653 | 1,110 | 6,331 | 4.4 | 3.7 | 2.8 | 1.6 | 2.8 | |
| 2015 | 1,307 | 1,231 | 2,551 | 1,059 | 6,194 | 4.3 | 3.9 | 2.7 | 1.5 | 2.7 | |
| 2016 | 1,226 | 1,198 | 2,499 | 1,109 | 6,127 | 4.0 | 3.8 | 2.6 | 1.5 | 2.6 | |
| 2017 | 1,081 | 1,027 | 2,104 | 945 | 5,250 | 3.6 | 3.2 | 2.2 | 1.3 | 2.2 | |
| 2018 | 902 | 908 | 1,902 | 935 | 4,804 | 3.0 | 2.8 | 2.0 | 1.3 | 2.0 | |
| 2019 | 762 | 817 | 1,705 | 857 | 4,194 | 2.6 | 2.5 | 1.8 | 1.1 | 1.8 | |
| 2020 | 565 | 564 | 1,101 | 525 | 2,768 | 1.9 | 1.8 | 1.2 | 0.7 | 1.2 | |
| 2021 | 543 | 591 | 1,092 | 570 | 2,804 | 1.9 | 1.8 | 1.2 | 0.7 | 1.2 | |
| 2022 | 572 | 566 | 1,140 | 644 | 2,934 | 1.9 | 1.8 | 1.2 | 0.8 | 1.2 | |
| 2023 | 608 | 513 | 1,216 | 649 | 2,994 | 2.0 | 1.6 | 1.3 | 0.8 | 1.3 | |
| 2019 to 2023 average | 610 | 610 | 1,251 | 649 | 3,139 | 2.1 | 1.9 | 1.3 | 0.8 | 1.3 | |
| Female | 2014-18 average | 792 | 773 | 1,766 | 577 | 3,936 | 2.6 | 2.5 | 2.0 | 1.0 | 1.9 |
| 2013 | 882 | 892 | 1,987 | 598 | 4,376 | 2.8 | 3.0 | 2.2 | 1.0 | 2.1 | |
| 2014 | 870 | 857 | 1,989 | 616 | 4,350 | 2.8 | 2.8 | 2.2 | 1.1 | 2.1 | |
| 2015 | 845 | 853 | 1,899 | 582 | 4,201 | 2.8 | 2.8 | 2.1 | 1.0 | 2.0 | |
| 2016 | 903 | 817 | 1,967 | 618 | 4,344 | 3.0 | 2.7 | 2.2 | 1.0 | 2.0 | |
| 2017 | 734 | 708 | 1,602 | 547 | 3,632 | 2.5 | 2.3 | 1.8 | 0.9 | 1.7 | |
| 2018 | 607 | 631 | 1,372 | 520 | 3,154 | 2.1 | 2.0 | 1.5 | 0.8 | 1.5 | |
| 2019 | 551 | 592 | 1,239 | 506 | 2,903 | 1.9 | 1.9 | 1.4 | 0.8 | 1.4 | |
| 2020 | 352 | 389 | 699 | 243 | 1,684 | 1.2 | 1.3 | 0.8 | 0.4 | 0.8 | |
| 2021 | 320 | 340 | 772 | 303 | 1,738 | 1.1 | 1.1 | 0.9 | 0.5 | 0.8 | |
| 2022 | 315 | 362 | 810 | 370 | 1,862 | 1.1 | 1.2 | 0.9 | 0.5 | 0.9 | |
| 2023 | 321 | 405 | 847 | 404 | 1,986 | 1.1 | 1.3 | 1.0 | 0.6 | 0.9 | |
| 2019 to 2023 average | 372 | 418 | 873 | 365 | 2,035 | 1.3 | 1.4 | 1.0 | 0.5 | 0.9 | |
| Total 4 | 2014-18 average | 1,987 | 1,927 | 4,162 | 1,611 | 10,196 | 3.3 | 3.1 | 2.3 | 1.2 | 2.2 |
| 2013 | 2,220 | 2,131 | 4,865 | 1,704 | 11,220 | 3.6 | 3.5 | 2.6 | 1.3 | 2.5 | |
| 2014 | 2,247 | 2,116 | 4,749 | 1,727 | 11,191 | 3.7 | 3.4 | 2.6 | 1.3 | 2.5 | |
| 2015 | 2,184 | 2,192 | 4,524 | 1,645 | 10,935 | 3.6 | 3.5 | 2.5 | 1.3 | 2.4 | |
| 2016 | 2,162 | 2,038 | 4,517 | 1,733 | 11,077 | 3.6 | 3.3 | 2.4 | 1.3 | 2.4 | |
| 2017 | 1,821 | 1,745 | 3,728 | 1,495 | 9,406 | 3.0 | 2.8 | 2.0 | 1.1 | 2.0 | |
| 2018 | 1,522 | 1,545 | 3,291 | 1,456 | 8,373 | 2.6 | 2.4 | 1.8 | 1.1 | 1.8 | |
| 2019 | 1,341 | 1,420 | 2,955 | 1,367 | 7,490 | 2.3 | 2.2 | 1.6 | 1.0 | 1.6 | |
| 2020 | 951 | 964 | 1,812 | 781 | 4,669 | 1.6 | 1.5 | 1.0 | 0.6 | 1.0 | |
| 2021 | 890 | 943 | 1,879 | 877 | 4,784 | 1.5 | 1.5 | 1.0 | 0.6 | 1.0 | |
| 2022 | 912 | 943 | 1,978 | 1,017 | 5,077 | 1.5 | 1.5 | 1.1 | 0.7 | 1.1 | |
| 2023 | 962 | 935 | 2,091 | 1,056 | 5,249 | 1.6 | 1.5 | 1.2 | 0.7 | 1.1 | |
| 2019 to 2023 average | 1,011 | 1,041 | 2,143 | 1,020 | 5,454 | 1.7 | 1.7 | 1.2 | 0.7 | 1.2 | |
| Male Female Ratio | 2014-18 average | 1.5 | 1.4 | 1.3 | 1.8 | 1.5 | 1.5 | 1.4 | 1.3 | 1.4 | 1.3 |
| 2013 | 1.5 | 1.3 | 1.4 | 1.8 | 1.4 | 1.5 | 1.2 | 1.3 | 1.6 | 1.3 | |
| 2014 | 1.6 | 1.4 | 1.3 | 1.8 | 1.5 | 1.6 | 1.3 | 1.3 | 1.5 | 1.3 | |
| 2015 | 1.5 | 1.4 | 1.3 | 1.8 | 1.5 | 1.5 | 1.4 | 1.3 | 1.5 | 1.4 | |
| 2016 | 1.4 | 1.5 | 1.3 | 1.8 | 1.4 | 1.3 | 1.4 | 1.2 | 1.5 | 1.3 | |
| 2017 | 1.5 | 1.5 | 1.3 | 1.7 | 1.4 | 1.4 | 1.4 | 1.2 | 1.4 | 1.3 | |
| 2018 | 1.5 | 1.4 | 1.4 | 1.8 | 1.5 | 1.4 | 1.4 | 1.3 | 1.6 | 1.3 | |
| 2019 | 1.4 | 1.4 | 1.4 | 1.7 | 1.4 | 1.4 | 1.3 | 1.3 | 1.4 | 1.3 | |
| 2020 | 1.6 | 1.4 | 1.6 | 2.2 | 1.6 | 1.6 | 1.4 | 1.5 | 1.8 | 1.5 | |
| 2021 | 1.7 | 1.7 | 1.4 | 1.9 | 1.6 | 1.7 | 1.6 | 1.3 | 1.4 | 1.5 | |
| 2022 | 1.8 | 1.6 | 1.4 | 1.7 | 1.6 | 1.7 | 1.5 | 1.3 | 1.6 | 1.3 | |
| 2023 | 1.9 | 1.3 | 1.4 | 1.6 | 1.5 | 1.8 | 1.2 | 1.3 | 1.3 | 1.4 | |
| 2019 to 2023 average | 1.6 | 1.5 | 1.4 | 1.8 | 1.5 | 1.6 | 1.4 | 1.3 | 1.6 | 1.4 | |
1. In some cases, a driver's age and/or sex was not known. Such drivers are counted in the table on the basis of whatever details are known - i.e. in the appropriate age-groups if their ages are known, and in the appropriate sex category if their sex is known. The 'all ages' totals include those whose ages were not traced, and the 'both sexes' totals include those of unknown sex. The grand totals include those for whom neither the age nor the sex was known, most of whom will be the drivers of cars which were parked at the time of the collision.
2. Including drivers whose age is not known.
3. Excludes drivers under 17 and those where ages and sex are not known.
4. Including drivers whose age is not known.
5. Mid-year population estimates for 2022 were not available, estimates for 2021 used instead.
< Previous | Contents | Next >