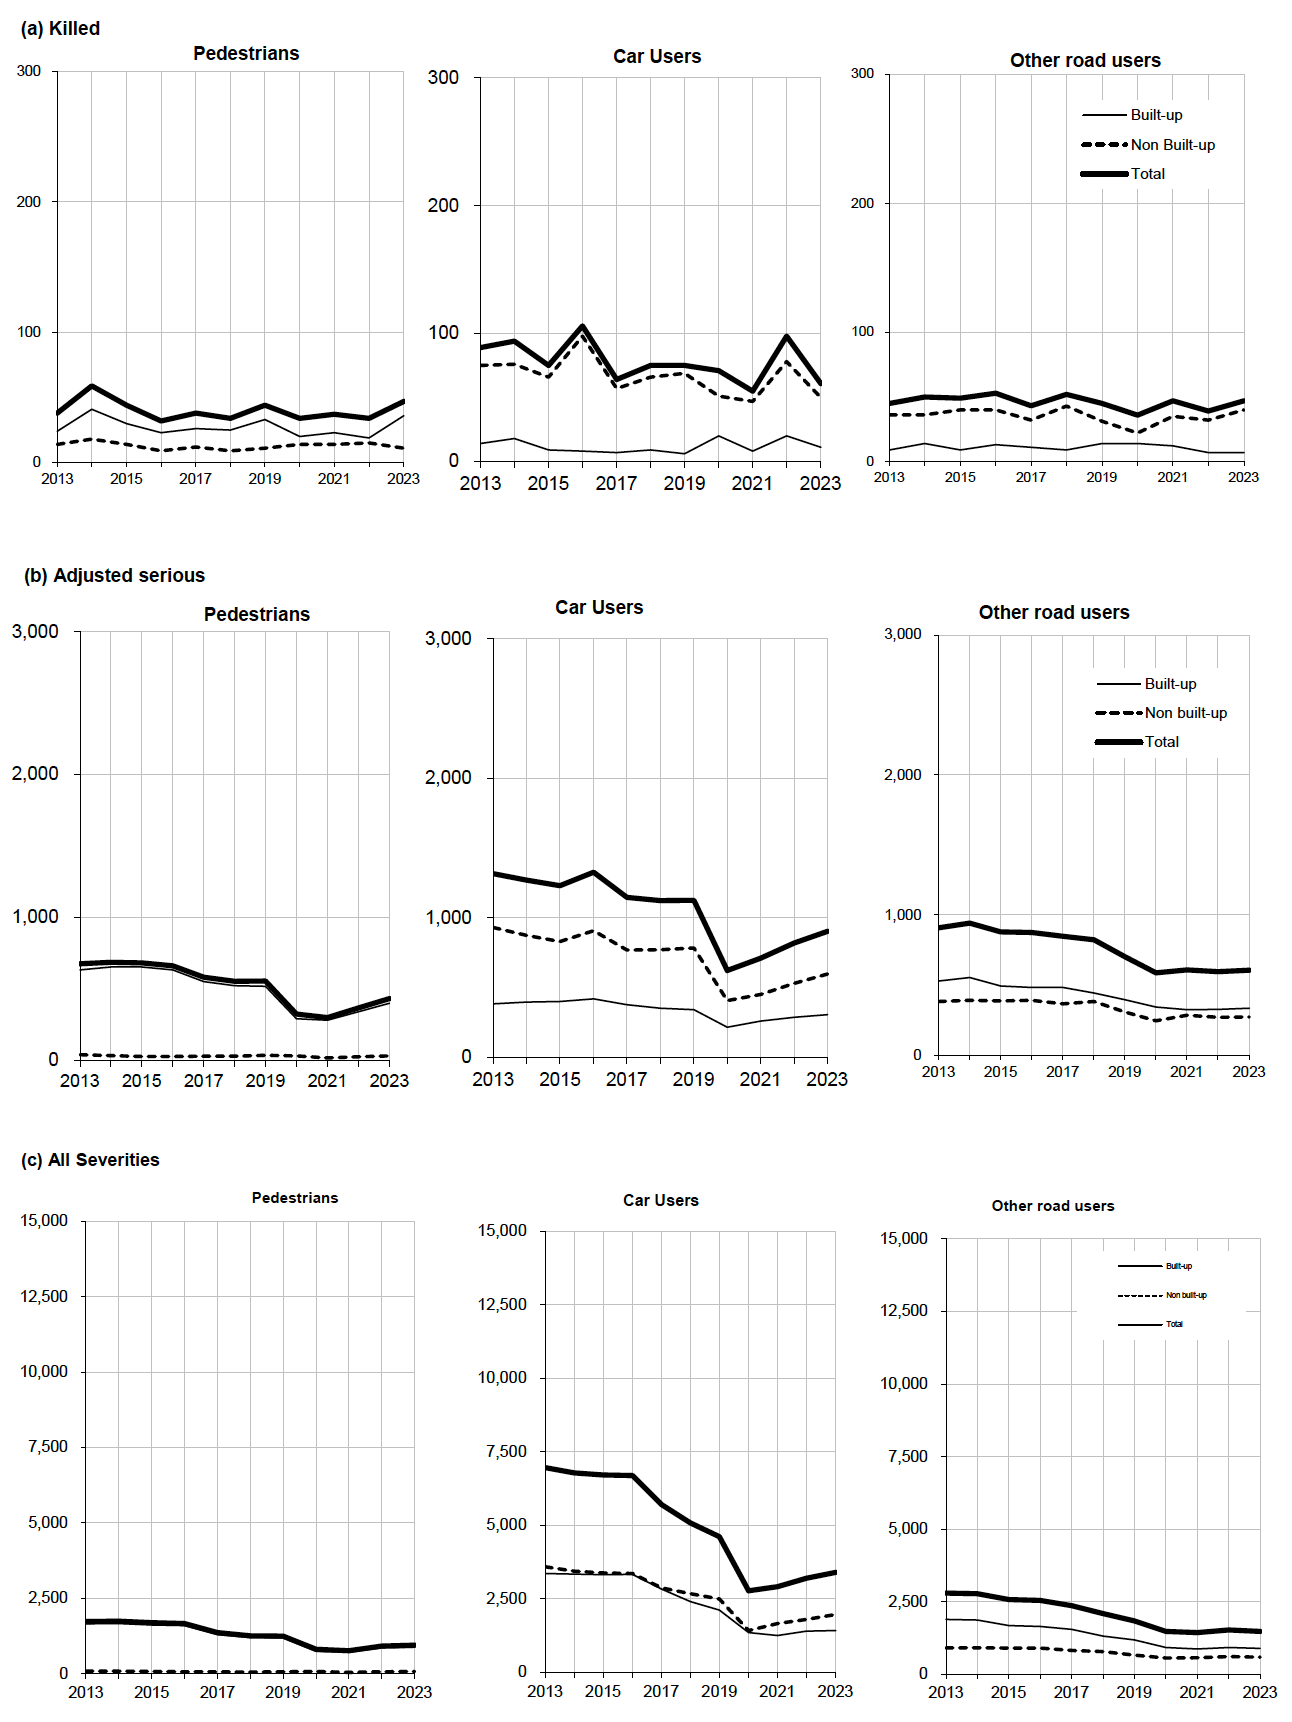
Table 23: Reported casualties by mode of transport and severity
Table 23: Reported casualties by mode of transport and severity
Separately for built-up and non built-up roads
Years: 2014-18 and 2019-2023 averages, 2013 to 2023
Casualties
| Mode of transport | Year | Built-up | Non built-up | Total | ||||||
|---|---|---|---|---|---|---|---|---|---|---|
| Killed | Adjusted serious | All Severities | Killed | Adjusted Serious | All Severities | Killed | Adjusted Serious | All Severities | ||
| (a) Numbers | ||||||||||
| Pedestrian | 2014-18 average | 29 | 604 | 1,476 | 12 | 31 | 68 | 41 | 635 | 1,543 |
| 2013 | 24 | 635 | 1,653 | 14 | 42 | 81 | 38 | 677 | 1,734 | |
| 2014 | 41 | 654 | 1,662 | 18 | 34 | 83 | 59 | 689 | 1,745 | |
| 2015 | 30 | 655 | 1,619 | 14 | 29 | 71 | 44 | 684 | 1,690 | |
| 2016 | 23 | 634 | 1,600 | 9 | 30 | 63 | 32 | 664 | 1,663 | |
| 2017 | 26 | 552 | 1,298 | 12 | 32 | 65 | 38 | 583 | 1,363 | |
| 2018 | 25 | 523 | 1,199 | 9 | 31 | 57 | 34 | 554 | 1,256 | |
| 2019 | 33 | 521 | 1,188 | 11 | 36 | 64 | 44 | 557 | 1,252 | |
| 2020 | 20 | 293 | 742 | 14 | 33 | 74 | 34 | 326 | 816 | |
| 2021 | 23 | 282 | 719 | 14 | 19 | 48 | 37 | 301 | 767 | |
| 2022 | 19 | 342 | 856 | 15 | 27 | 61 | 34 | 369 | 917 | |
| 2023 | 36 | 402 | 878 | 11 | 32 | 74 | 47 | 434 | 952 | |
| 2019 to 2023 average | 26 | 368 | 877 | 13 | 30 | 64 | 39 | 397 | 941 | |
| Pedal cycle | 2014-18 average | 3 | 224 | 670 | 4 | 51 | 99 | 6 | 274 | 770 |
| 2013 | 2 | 232 | 783 | 11 | 46 | 103 | 13 | 277 | 886 | |
| 2014 | 3 | 239 | 789 | 5 | 48 | 106 | 8 | 287 | 895 | |
| 2015 | 2 | 229 | 691 | 3 | 53 | 106 | 5 | 282 | 797 | |
| 2016 | 3 | 224 | 682 | 5 | 48 | 108 | 8 | 272 | 790 | |
| 2017 | 3 | 223 | 634 | 2 | 53 | 94 | 5 | 276 | 728 | |
| 2018 | 2 | 205 | 555 | 4 | 50 | 83 | 6 | 255 | 638 | |
| 2019 | 3 | 192 | 520 | 6 | 35 | 71 | 9 | 227 | 591 | |
| 2020 | 5 | 194 | 508 | 6 | 52 | 101 | 11 | 246 | 609 | |
| 2021 | 3 | 158 | 423 | 6 | 39 | 88 | 9 | 197 | 511 | |
| 2022 | 1 | 149 | 419 | 1 | 31 | 61 | 2 | 180 | 480 | |
| 2023 | 3 | 124 | 335 | 4 | 34 | 70 | 7 | 158 | 405 | |
| 2019 to 2023 average | 3 | 163 | 441 | 5 | 38 | 78 | 8 | 202 | 519 | |
| Motorcycle 1 | 2014-18 average | 5 | 173 | 370 | 25 | 218 | 336 | 30 | 391 | 706 |
| 2013 | 5 | 190 | 428 | 18 | 214 | 347 | 23 | 404 | 775 | |
| 2014 | 6 | 217 | 463 | 24 | 230 | 363 | 30 | 447 | 826 | |
| 2015 | 3 | 170 | 396 | 24 | 212 | 339 | 27 | 381 | 735 | |
| 2016 | 7 | 165 | 372 | 23 | 217 | 337 | 30 | 382 | 709 | |
| 2017 | 3 | 167 | 316 | 26 | 202 | 304 | 29 | 369 | 620 | |
| 2018 | 5 | 147 | 302 | 28 | 229 | 338 | 33 | 376 | 640 | |
| 2019 | 6 | 126 | 257 | 19 | 185 | 265 | 25 | 311 | 522 | |
| 2020 | 7 | 103 | 207 | 9 | 138 | 212 | 16 | 241 | 419 | |
| 2021 | 5 | 108 | 198 | 25 | 171 | 260 | 30 | 279 | 458 | |
| 2022 | 3 | 114 | 208 | 22 | 166 | 259 | 25 | 280 | 467 | |
| 2023 | - | 122 | 222 | 27 | 170 | 255 | 27 | 292 | 477 | |
| 2019 to 2023 average | 4 | 115 | 218 | 20 | 166 | 250 | 25 | 281 | 469 | |
| Car | 2014-18 average | 10 | 389 | 3,049 | 73 | 831 | 3,148 | 83 | 1,220 | 6,198 |
| 2013 | 14 | 384 | 3,368 | 75 | 931 | 3,596 | 89 | 1,316 | 6,964 | |
| 2014 | 18 | 396 | 3,343 | 76 | 875 | 3,443 | 94 | 1,271 | 6,786 | |
| 2015 | 9 | 400 | 3,325 | 66 | 830 | 3,388 | 75 | 1,230 | 6,713 | |
| 2016 | 8 | 420 | 3,332 | 98 | 907 | 3,365 | 106 | 1,327 | 6,697 | |
| 2017 | 7 | 377 | 2,835 | 57 | 769 | 2,872 | 64 | 1,146 | 5,707 | |
| 2018 | 9 | 353 | 2,412 | 66 | 772 | 2,673 | 75 | 1,125 | 5,085 | |
| 2019 | 6 | 342 | 2,117 | 69 | 785 | 2,497 | 75 | 1,126 | 4,614 | |
| 2020 | 20 | 217 | 1,358 | 51 | 407 | 1,421 | 71 | 624 | 2,779 | |
| 2021 | 8 | 260 | 1,253 | 47 | 451 | 1,661 | 55 | 711 | 2,914 | |
| 2022 | 20 | 288 | 1,407 | 78 | 531 | 1,802 | 98 | 819 | 3,209 | |
| 2023 | 11 | 306 | 1,427 | 50 | 598 | 1,975 | 61 | 904 | 3,402 | |
| 2019 to 2023 average | 13 | 283 | 1,512 | 59 | 554 | 1,871 | 72 | 837 | 3,384 | |
Table 23 (continued): Reported casualties by mode of transport and severity
Separately for built-up and non built-up roads
Years: 2014-18 and 2019-2023 averages, 2013 to 2023
| Mode oftransport | Year | Built-up | Non built-up | Total | ||||||
|---|---|---|---|---|---|---|---|---|---|---|
| Killed | Adjustedserious | AllSeverities | Killed | Adjustedserious | AllSeverities | Killed | Adjustedserious | AllSeverities | ||
| Taxi | 2014-18 average | 0 | 15 | 121 | 0 | 5 | 24 | 1 | 19 | 145 |
| 2013 | 1 | 18 | 139 | - | 3 | 13 | 1 | 22 | 152 | |
| 2014 | 1 | 15 | 142 | - | 3 | 22 | 1 | 18 | 164 | |
| 2015 | 1 | 14 | 120 | - | 4 | 17 | 1 | 17 | 137 | |
| 2016 | - | 16 | 129 | 1 | 7 | 26 | 1 | 22 | 155 | |
| 2017 | - | 17 | 133 | - | 6 | 31 | - | 22 | 164 | |
| 2018 | - | 12 | 83 | 1 | 3 | 22 | 1 | 15 | 105 | |
| 2019 | - | 19 | 113 | - | 4 | 26 | - | 23 | 139 | |
| 2020 | - | 11 | 54 | 1 | 1 | 13 | 1 | 12 | 67 | |
| 2021 | 1 | 8 | 54 | - | 3 | 13 | 1 | 11 | 67 | |
| 2022 | 2 | 10 | 65 | - | 3 | 11 | 2 | 13 | 76 | |
| 2023 | 1 | 12 | 85 | - | 9 | 33 | 1 | 21 | 118 | |
| 2019 to 2023 average | 1 | 12 | 74 | 0 | 4 | 19 | 1 | 16 | 93 | |
| Minibus | 2014-18 average | 0 | 1 | 10 | 1 | 5 | 21 | 1 | 6 | 31 |
| 2013 | - | 4 | 12 | 1 | 16 | 41 | 1 | 19 | 53 | |
| 2014 | 1 | 1 | 11 | - | 5 | 25 | 1 | 6 | 36 | |
| 2015 | - | 0 | 8 | - | 6 | 26 | - | 6 | 34 | |
| 2016 | - | 2 | 18 | 2 | 5 | 30 | 2 | 7 | 48 | |
| 2017 | - | 1 | 9 | - | 3 | 8 | - | 3 | 17 | |
| 2018 | - | 0 | 4 | 2 | 5 | 17 | 2 | 5 | 21 | |
| 2019 | - | 1 | 6 | - | 7 | 18 | - | 9 | 24 | |
| 2020 | - | 1 | 7 | - | - | 6 | - | 1 | 13 | |
| 2021 | - | 1 | 14 | 1 | 3 | 6 | 1 | 4 | 20 | |
| 2022 | - | - | 7 | - | 6 | 9 | - | 6 | 16 | |
| 2023 | - | 1 | 3 | - | - | 4 | - | 1 | 7 | |
| 2019 to 2023 average | - | 1 | 7 | 0 | 3 | 9 | 0 | 4 | 16 | |
| Bus/coach | 2014-18 average | 1 | 46 | 246 | 1 | 18 | 57 | 2 | 63 | 302 |
| 2013 | 1 | 56 | 317 | 1 | 14 | 77 | 2 | 69 | 394 | |
| 2014 | 1 | 45 | 257 | - | 8 | 34 | 1 | 53 | 291 | |
| 2015 | 1 | 46 | 259 | - | 32 | 73 | 1 | 77 | 332 | |
| 2016 | - | 47 | 227 | 3 | 23 | 75 | 3 | 70 | 302 | |
| 2017 | 2 | 45 | 278 | - | 15 | 79 | 2 | 59 | 357 | |
| 2018 | - | 47 | 208 | 2 | 10 | 22 | 2 | 58 | 230 | |
| 2019 | 3 | 28 | 167 | - | 7 | 32 | 3 | 34 | 199 | |
| 2020 | - | 15 | 56 | - | 5 | 30 | - | 20 | 86 | |
| 2021 | 2 | 23 | 74 | - | 4 | 6 | 2 | 27 | 80 | |
| 2022 | - | 17 | 83 | - | 3 | 34 | - | 20 | 117 | |
| 2023 | - | 37 | 121 | 1 | 6 | 26 | 1 | 43 | 147 | |
| 2019 to 2023 average | 1 | 24 | 100 | 0 | 5 | 26 | 1 | 29 | 126 | |
| Light goods | 2014-18 average | 0 | 16 | 134 | 3 | 53 | 213 | 3 | 68 | 347 |
| 2013 | - | 17 | 144 | 4 | 40 | 188 | 4 | 57 | 332 | |
| 2014 | - | 15 | 135 | - | 49 | 213 | - | 64 | 348 | |
| 2015 | - | 20 | 136 | 5 | 48 | 218 | 5 | 68 | 354 | |
| 2016 | - | 16 | 165 | 5 | 59 | 226 | 5 | 75 | 391 | |
| 2017 | - | 16 | 125 | 2 | 50 | 198 | 2 | 66 | 323 | |
| 2018 | 1 | 13 | 109 | 4 | 56 | 211 | 5 | 69 | 320 | |
| 2019 | - | 13 | 71 | 4 | 43 | 175 | 4 | 56 | 246 | |
| 2020 | 2 | 6 | 44 | 4 | 30 | 127 | 6 | 36 | 171 | |
| 2021 | 1 | 5 | 47 | 1 | 35 | 121 | 2 | 40 | 168 | |
| 2022 | 1 | 10 | 74 | 1 | 41 | 140 | 2 | 51 | 214 | |
| 2023 | 1 | 8 | 56 | 3 | 29 | 127 | 4 | 37 | 183 | |
| 2019 to 2023 average | 1 | 9 | 58 | 3 | 36 | 138 | 4 | 44 | 196 | |
Table 23 (continued): Reported casualties by mode of transport and severity
Separately for built-up and non built-up roads
Years: 2014-18 and 2019-2023 averages, 2013 to 2023
| Mode oftransport | Year | Built-up | Non built-up | Total | ||||||
|---|---|---|---|---|---|---|---|---|---|---|
| Killed | Adjustedserious | AllSeverities | Killed | Adjustedserious | AllSeverities | Killed | Adjustedserious | AllSeverities | ||
| Heavy goods | 2014-18 average | 0 | 5 | 23 | 2 | 20 | 68 | 2 | 25 | 91 |
| 2013 | - | 5 | 23 | 1 | 29 | 86 | 1 | 34 | 109 | |
| 2014 | - | 6 | 28 | 2 | 24 | 78 | 2 | 30 | 106 | |
| 2015 | 1 | 7 | 31 | 7 | 19 | 85 | 8 | 26 | 116 | |
| 2016 | - | 3 | 14 | 1 | 22 | 68 | 1 | 25 | 82 | |
| 2017 | 1 | 5 | 24 | - | 16 | 55 | 1 | 21 | 79 | |
| 2018 | - | 6 | 20 | - | 16 | 53 | - | 23 | 73 | |
| 2019 | - | 8 | 18 | 2 | 15 | 37 | 2 | 23 | 55 | |
| 2020 | - | 4 | 15 | 1 | 9 | 28 | 1 | 13 | 43 | |
| 2021 | - | 2 | 7 | 1 | 12 | 38 | 1 | 14 | 45 | |
| 2022 | - | 3 | 9 | 5 | 3 | 27 | 5 | 6 | 36 | |
| 2023 | - | 2 | 6 | 2 | 6 | 24 | 2 | 8 | 30 | |
| 2019 to 2023 average | - | 4 | 11 | 2 | 9 | 31 | 2 | 13 | 42 | |
| Other | 2014-18 average | 2 | 11 | 32 | 2 | 16 | 41 | 4 | 27 | 73 |
| 2013 | - | 8 | 37 | - | 20 | 56 | - | 28 | 93 | |
| 2014 | 2 | 16 | 40 | 5 | 22 | 65 | 7 | 38 | 105 | |
| 2015 | 1 | 8 | 35 | 1 | 13 | 34 | 2 | 21 | 69 | |
| 2016 | 3 | 10 | 32 | - | 11 | 29 | 3 | 21 | 61 | |
| 2017 | 2 | 11 | 27 | 2 | 21 | 48 | 4 | 32 | 75 | |
| 2018 | 1 | 13 | 26 | 2 | 11 | 30 | 3 | 23 | 56 | |
| 2019 | 2 | 8 | 29 | - | 10 | 34 | 2 | 18 | 63 | |
| 2020 | - | 9 | 29 | 1 | 10 | 33 | 1 | 19 | 62 | |
| 2021 | - | 19 | 48 | 1 | 17 | 36 | 1 | 36 | 84 | |
| 2022 | - | 23 | 53 | 3 | 16 | 58 | 3 | 39 | 111 | |
| 2023 | 2 | 28 | 60 | 3 | 18 | 48 | 5 | 46 | 108 | |
| 2019 to 2023 average | 1 | 18 | 44 | 2 | 14 | 42 | 2 | 32 | 86 | |
| Total | 2014-18 average | 50 | 1,483 | 6,132 | 123 | 1,245 | 4,075 | 174 | 2,728 | 10,207 |
| 2013 | 47 | 1,547 | 6,904 | 125 | 1,354 | 4,588 | 172 | 2,901 | 11,492 | |
| 2014 | 73 | 1,603 | 6,870 | 130 | 1,299 | 4,432 | 203 | 2,901 | 11,302 | |
| 2015 | 48 | 1,548 | 6,620 | 120 | 1,245 | 4,357 | 168 | 2,793 | 10,977 | |
| 2016 | 44 | 1,537 | 6,571 | 147 | 1,328 | 4,327 | 191 | 2,865 | 10,898 | |
| 2017 | 44 | 1,412 | 5,679 | 101 | 1,166 | 3,754 | 145 | 2,578 | 9,433 | |
| 2018 | 43 | 1,318 | 4,918 | 118 | 1,184 | 3,506 | 161 | 2,503 | 8,424 | |
| 2019 | 53 | 1,258 | 4,486 | 111 | 1,127 | 3,219 | 164 | 2,385 | 7,705 | |
| 2020 | 54 | 853 | 3,020 | 87 | 685 | 2,045 | 141 | 1,538 | 5,065 | |
| 2021 | 43 | 866 | 2,837 | 96 | 754 | 2,277 | 139 | 1,620 | 5,114 | |
| 2022 | 46 | 956 | 3,181 | 125 | 827 | 2,462 | 171 | 1,783 | 5,643 | |
| 2023 | 54 | 1,042 | 3,193 | 101 | 902 | 2,636 | 155 | 1,944 | 5,829 | |
| 2019 to 2023 average | 50 | 995 | 3,343 | 104 | 859 | 2,528 | 154 | 1,854 | 5,871 | |
2. Due to changes in the the way casualty severities are recorded, figures for serious casualties in 2019 and 2020 are not comparable with previous years.
Table 23 (continued): Reported casualties by mode of transport and severity
Separately for built-up and non built-up roads
Years: 2014-18 and 2019-2023 averages, 2013 to 2023
| Mode of Transport | Built-up | Non built-up | Total | ||||||
|---|---|---|---|---|---|---|---|---|---|
| Killed | Adjusted serious | All Severities | Killed | Adjusted serious | All Severities | Killed | Adjusted serious | AllSeverities | |
| (b) Change in numbers: 2023 on 2022 | |||||||||
| Pedestrian | 17 | 60 | 22 | -4 | 5 | 13 | 13 | 65 | 35 |
| Pedal cycle | 2 | -25 | -84 | 3 | 3 | 9 | 5 | -22 | -75 |
| Motorcycle1 | -3 | 8 | 14 | 5 | 4 | -4 | 2 | 12 | 10 |
| Car | -9 | 18 | 20 | -28 | 67 | 173 | -37 | 85 | 193 |
| Taxi | -1 | 2 | 20 | - | 6 | 22 | -1 | 8 | 42 |
| Minibus | - | 1 | -4 | - | -6 | -5 | - | -5 | -9 |
| Bus/coach | - | 20 | 38 | 1 | 3 | -8 | 1 | 23 | 30 |
| Light goods | - | -2 | -18 | 2 | -12 | -13 | 2 | -14 | -31 |
| Heavy goods | - | -1 | -3 | -3 | 3 | -3 | -3 | 2 | -6 |
| Other | 2 | 5 | 7 | - | 2 | -10 | 2 | 7 | -3 |
| Total | 8 | 86 | 12 | -24 | 75 | 174 | -16 | 161 | 186 |
| (c) Per cent changes: 2 | |||||||||
| 2023 on 2022 | |||||||||
| Pedestrian | 89 | 18 | 3 | -27 | 19 | 21 | 38 | 18 | 4 |
| Pedal cycle | * | -17 | -20 | * | 10 | 15 | * | -12 | -16 |
| Motorcycle(1) | * | 7 | 7 | 23 | 2 | -2 | 8 | 4 | 2 |
| Car | -45 | 6 | 1 | -36 | 13 | 10 | -38 | 10 | 6 |
| Taxi | * | 20 | 31 | n/a | * | 200 | * | 62 | 55 |
| Minibus | n/a | n/a | * | n/a | * | * | n/a | * | -56 |
| Bus/coach | n/a | 118 | 46 | n/a | * | -24 | n/a | 115 | 26 |
| Light goods | * | -20 | -24 | * | -29 | -9 | * | -27 | -14 |
| Heavy goods | n/a | * | * | * | * | -11 | * | * | -17 |
| Other | n/a | 22 | 13 | * | 13 | -17 | * | 18 | -3 |
| Total | 17 | 9 | 0 | -19 | 9 | 7 | -9 | 9 | 3 |
| 2023 on 2014-18 average | |||||||||
| Pedestrian | 24 | -33 | -40 | -11 | 3 | 9 | 14 | -32 | -38 |
| Pedal cycle | * | -45 | -50 | * | -33 | -30 | * | -42 | -47 |
| Motorcycle 1 | * | -30 | -40 | 8 | -22 | -24 | -9 | -25 | -32 |
| Car | 8 | -21 | -53 | -31 | -28 | -37 | -26 | -26 | -45 |
| Taxi | * | -17 | -30 | * | * | 40 | * | 11 | -19 |
| Minibus | * | * | -70 | * | * | -81 | * | * | -78 |
| Bus/coach | * | -19 | -51 | * | -66 | -54 | * | -32 | -51 |
| Light goods | * | -50 | -58 | * | -45 | -40 | * | -46 | -47 |
| Heavy goods | * | * | -74 | * | -69 | -65 | * | -68 | -67 |
| Other | * | 148 | 88 | * | 15 | 17 | * | 70 | 48 |
| Total | 7 | -30 | -48 | -18 | -28 | -35 | -11 | -29 | -43 |
* A percentage changes is not shown if the denominator is 10 or fewer.
1. Motorcycle includes all two wheeled motor vehicles
2. Care should be taken when using per cent changes due to the small numbers involved.
< Previous | Contents | Next >