Table 32: Reported casualties by age and severity, separately for each mode of transport, numbers and rates per thousand population
Table 32: Reported casualties by age and severity, separately for each mode of transport, numbers and rates per thousand population
Years: 2019-2023 average
Population Estimates
| Mode of Transport | Age group | Killed | Adjusted serious | Adjusted slight | All Severities | Killed | Adjusted serious | Adjusted slight | All Severities |
|---|---|---|---|---|---|---|---|---|---|
| numbers | rates per thousand population | ||||||||
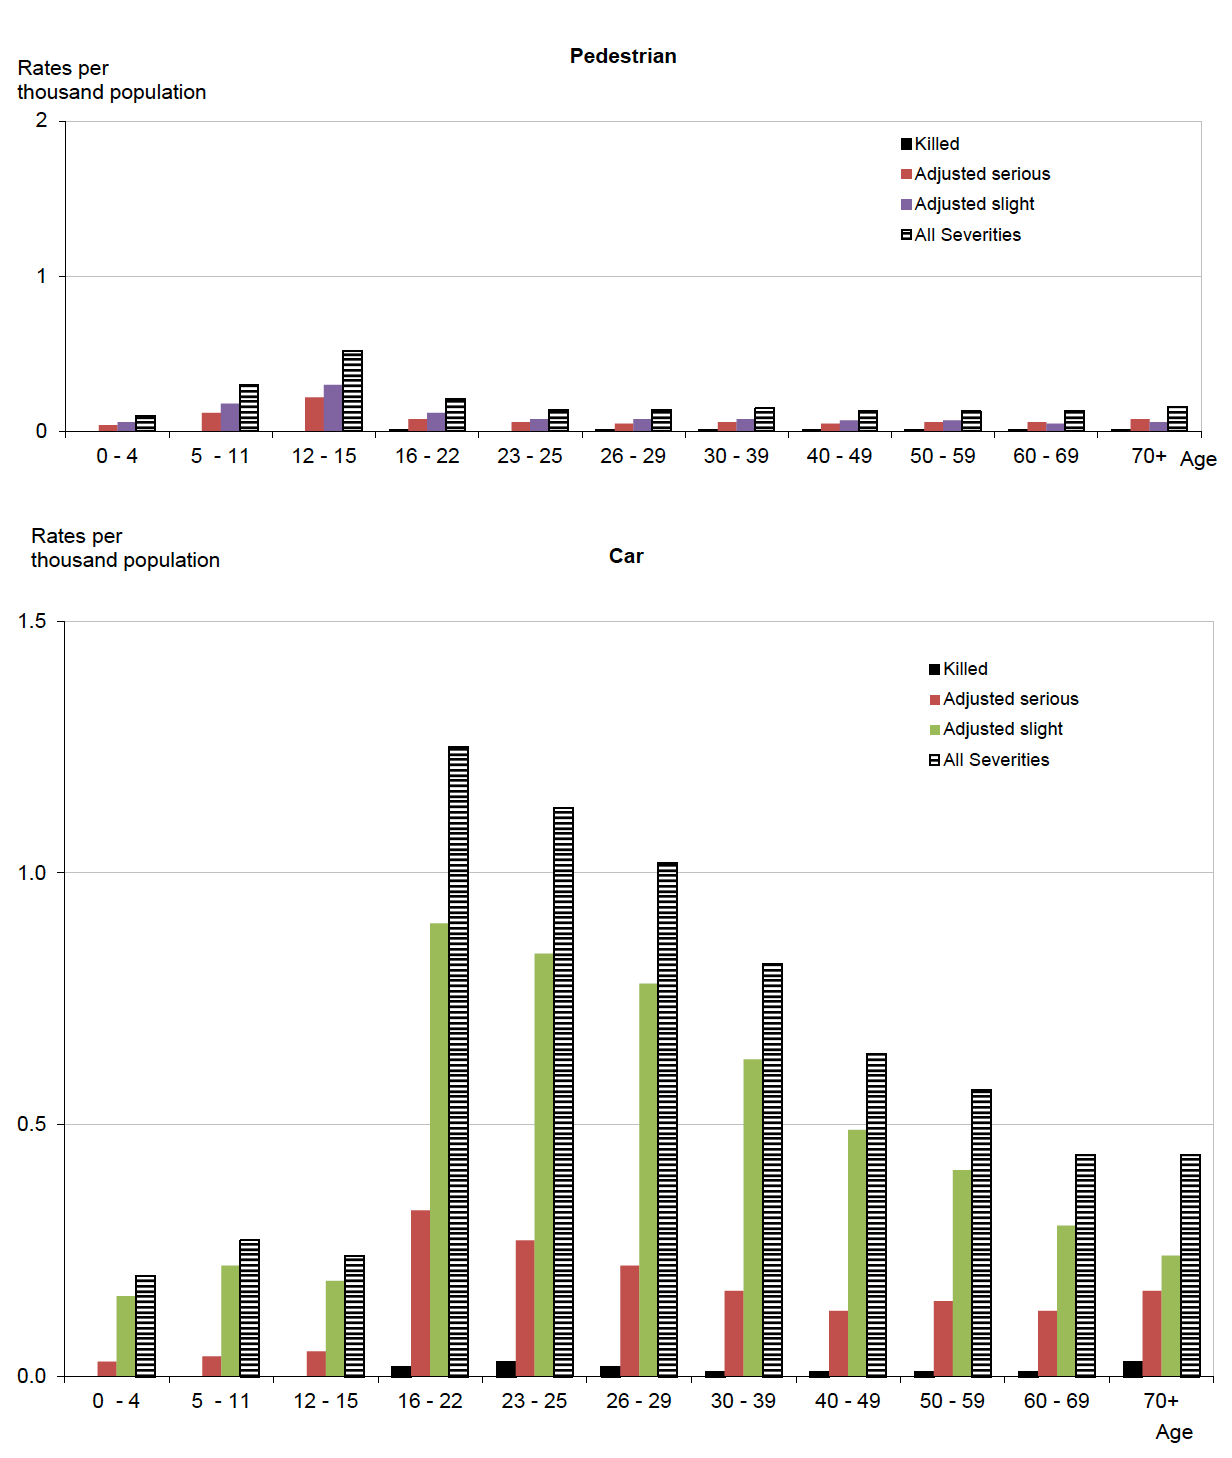
| Pedestrian | 0 - 4 | 1 | 9 | 15 | 25 | - | 0.04 | 0.06 | 0.10 |
| 5 - 11 | - | 48 | 75 | 124 | - | 0.12 | 0.18 | 0.30 | |
| 12 - 15 | 1 | 51 | 71 | 124 | - | 0.22 | 0.30 | 0.52 | |
| 16 - 22 | 3 | 35 | 54 | 93 | 0.01 | 0.08 | 0.12 | 0.21 | |
| 23-25 | 1 | 12 | 16 | 29 | - | 0.06 | 0.08 | 0.14 | |
| 26-29 | 2 | 15 | 23 | 40 | 0.01 | 0.05 | 0.08 | 0.14 | |
| 30 - 39 | 6 | 42 | 57 | 106 | 0.01 | 0.06 | 0.08 | 0.15 | |
| 40 - 49 | 6 | 34 | 46 | 86 | 0.01 | 0.05 | 0.07 | 0.13 | |
| 50 - 59 | 4 | 46 | 53 | 104 | 0.01 | 0.06 | 0.07 | 0.13 | |
| 60 - 69 | 6 | 42 | 37 | 85 | 0.01 | 0.06 | 0.05 | 0.13 | |
| 70 & over | 11 | 63 | 49 | 123 | 0.01 | 0.08 | 0.06 | 0.16 | |
| Total 1 | 39 | 397 | 496 | 941 | 0.01 | 0.07 | 0.09 | 0.17 | |
| Child 0-15 | 2 | 108 | 161 | 272 | - | 0.12 | 0.18 | 0.30 | |
| Adult 16+ | 37 | 289 | 334 | 667 | 0.01 | 0.06 | 0.07 | 0.15 | |
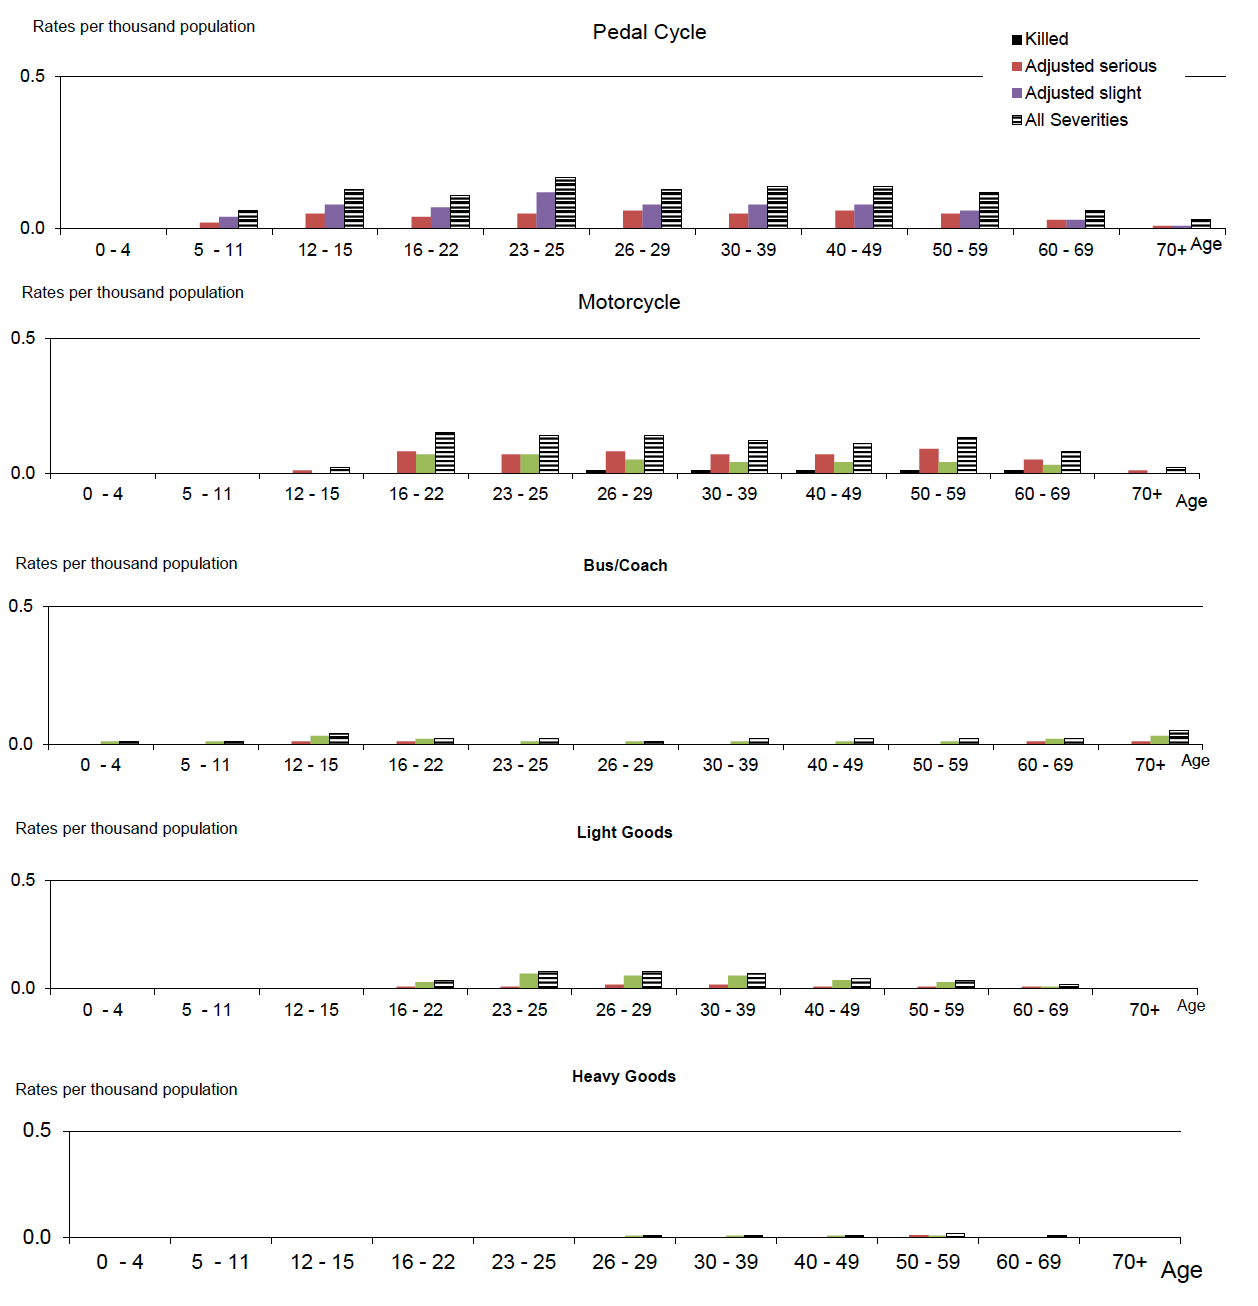
| Pedal Cycle | 0 - 4 | - | - | 1 | 1 | - | - | - | - |
| 5 - 11 | - | 7 | 15 | 23 | - | 0.02 | 0.04 | 0.06 | |
| 12 - 15 | - | 11 | 18 | 30 | - | 0.05 | 0.08 | 0.13 | |
| 16 - 22 | - | 16 | 32 | 49 | - | 0.04 | 0.07 | 0.11 | |
| 23-25 | - | 9 | 24 | 34 | - | 0.05 | 0.12 | 0.17 | |
| 26-29 | - | 16 | 21 | 37 | - | 0.06 | 0.08 | 0.13 | |
| 30 - 39 | 2 | 36 | 60 | 98 | - | 0.05 | 0.08 | 0.14 | |
| 40 - 49 | 1 | 38 | 54 | 94 | - | 0.06 | 0.08 | 0.14 | |
| 50 - 59 | 1 | 40 | 49 | 92 | - | 0.05 | 0.06 | 0.12 | |
| 60 - 69 | 1 | 18 | 21 | 41 | - | 0.03 | 0.03 | 0.06 | |
| 70 & over | 1 | 10 | 8 | 20 | - | 0.01 | 0.01 | 0.03 | |
| Total 1 | 8 | 202 | 304 | 519 | - | 0.04 | 0.06 | 0.10 | |
| Child 0-15 | 1 | 18 | 34 | 54 | - | 0.02 | 0.04 | 0.06 | |
| Adult 16+ | 7 | 183 | 269 | 465 | - | 0.04 | 0.06 | 0.10 | |
| Motorcycle 2 | 0 - 4 | - | - | - | - | - | - | - | - |
| 5 - 11 | - | - | - | - | - | - | - | - | |
| 12 - 15 | - | 3 | 1 | 4 | - | 0.01 | - | 0.02 | |
| 16 - 22 | 2 | 34 | 30 | 66 | - | 0.08 | 0.07 | 0.15 | |
| 23-25 | 1 | 15 | 13 | 29 | - | 0.07 | 0.07 | 0.14 | |
| 26-29 | 2 | 22 | 14 | 38 | 0.01 | 0.08 | 0.05 | 0.14 | |
| 30 - 39 | 4 | 49 | 28 | 81 | 0.01 | 0.07 | 0.04 | 0.12 | |
| 40 - 49 | 4 | 45 | 25 | 75 | 0.01 | 0.07 | 0.04 | 0.11 | |
| 50 - 59 | 6 | 70 | 29 | 107 | 0.01 | 0.09 | 0.04 | 0.13 | |
| 60 - 69 | 5 | 33 | 17 | 55 | 0.01 | 0.05 | 0.03 | 0.08 | |
| 70 & over | 1 | 8 | 3 | 13 | - | 0.01 | - | 0.02 | |
| Total 1 | 25 | 281 | 162 | 469 | - | 0.05 | 0.03 | 0.09 | |
| Child 0-15 | - | 3 | 1 | 4 | - | - | - | - | |
| Adult 16+ | 25 | 278 | 160 | 464 | 0.01 | 0.06 | 0.04 | 0.10 | |
| Car | 0 - 4 | 1 | 8 | 42 | 50 | - | 0.03 | 0.16 | 0.20 |
| 5 - 11 | - | 17 | 91 | 109 | - | 0.04 | 0.22 | 0.27 | |
| 12 - 15 | - | 12 | 45 | 57 | - | 0.05 | 0.19 | 0.24 | |
| 16 - 22 | 8 | 145 | 398 | 555 | 0.02 | 0.33 | 0.90 | 1.25 | |
| 23-25 | 5 | 54 | 170 | 230 | 0.03 | 0.27 | 0.84 | 1.13 | |
| 26-29 | 4 | 61 | 214 | 281 | 0.02 | 0.22 | 0.78 | 1.02 | |
| 30 - 39 | 10 | 117 | 445 | 575 | 0.01 | 0.17 | 0.63 | 0.82 | |
| 40 - 49 | 7 | 90 | 331 | 431 | 0.01 | 0.13 | 0.49 | 0.64 | |
| 50 - 59 | 7 | 119 | 325 | 453 | 0.01 | 0.15 | 0.41 | 0.57 | |
| 60 - 69 | 9 | 85 | 206 | 301 | 0.01 | 0.13 | 0.30 | 0.44 | |
| 70 & over | 20 | 129 | 186 | 338 | 0.03 | 0.17 | 0.24 | 0.44 | |
| Total 1 | 72 | 837 | 2,454 | 3,384 | 0.01 | 0.15 | 0.45 | 0.62 | |
| Child 0-15 | 1 | 36 | 178 | 217 | - | 0.04 | 0.20 | 0.24 | |
| Adult 16+ | 71 | 801 | 2,275 | 3,165 | 0.02 | 0.18 | 0.50 | 0.70 | |
1. Includes those whose age was 'not known'
2. Motorcycle includes all two wheeled motor vehicles
Table 32 (continued): Reported casualties by age and severity, separately for each mode of transport
Numbers and rates per thousand population
Years: 2019-2023 average
| Road User | Age group | Killed | Adjusted serious | Adjusted slight | All Severities | Killed | Adjusted serious | Adjusted slight | All Severities |
|---|---|---|---|---|---|---|---|---|---|
| numbers | rates per thousand population | ||||||||
| Taxi | 0 - 4 | - | - | - | 1 | - | - | - | - |
| 5 - 11 | - | - | 1 | 1 | - | - | - | - | |
| 12 - 15 | - | - | 3 | 3 | - | - | 0.01 | 0.01 | |
| 16 - 22 | - | 1 | 6 | 6 | - | - | 0.01 | 0.01 | |
| 23-25 | - | - | 3 | 4 | - | - | 0.02 | 0.02 | |
| 26-29 | - | 1 | 5 | 5 | - | - | 0.02 | 0.02 | |
| 30 - 39 | - | 2 | 15 | 17 | - | - | 0.02 | 0.02 | |
| 40 - 49 | - | 2 | 12 | 15 | - | - | 0.02 | 0.02 | |
| 50 - 59 | 1 | 4 | 15 | 20 | - | 0.01 | 0.02 | 0.02 | |
| 60 - 69 | - | 3 | 11 | 14 | - | 0.01 | 0.02 | 0.02 | |
| 70 & over | - | 3 | 4 | 7 | - | - | 0.01 | 0.01 | |
| Total 1 | 1 | 16 | 75 | 93 | - | - | 0.01 | 0.02 | |
| Child 0-15 | - | 1 | 4 | 5 | - | - | - | 0.01 | |
| Adult 16+ | 1 | 15 | 70 | 88 | - | - | 0.02 | 0.02 | |
| Minibus | 0 - 4 | - | - | - | - | - | - | - | - |
| 5 - 11 | - | - | 1 | 1 | - | - | - | - | |
| 12 - 15 | - | - | - | 1 | - | - | - | - | |
| 16 - 22 | - | - | 1 | 1 | - | - | - | - | |
| 23-25 | - | - | - | - | - | - | - | - | |
| 26-29 | - | - | 1 | 1 | - | - | - | - | |
| 30 - 39 | - | - | 1 | 2 | - | - | - | - | |
| 40 - 49 | - | 1 | 2 | 3 | - | - | - | - | |
| 50 - 59 | - | 1 | 3 | 3 | - | - | - | - | |
| 60 - 69 | - | 1 | 2 | 3 | - | - | - | - | |
| 70 & over | - | - | - | 1 | - | - | - | - | |
| Total 1 | - | 4 | 11 | 16 | - | - | - | - | |
| Child 0-15 | - | - | 2 | 2 | - | - | - | - | |
| Adult 16+ | - | 4 | 10 | 14 | - | - | - | - | |
| Bus/Coach | 0 - 4 | - | - | 3 | 3 | - | - | 0.01 | 0.01 |
| 5 - 11 | - | 1 | 5 | 5 | - | - | 0.01 | 0.01 | |
| 12 - 15 | - | 3 | 7 | 10 | - | 0.01 | 0.03 | 0.04 | |
| 16 - 22 | - | 2 | 7 | 10 | - | 0.01 | 0.02 | 0.02 | |
| 23-25 | - | - | 3 | 4 | - | - | 0.01 | 0.02 | |
| 26-29 | - | - | 2 | 3 | - | - | 0.01 | 0.01 | |
| 30 - 39 | - | 2 | 10 | 12 | - | - | 0.01 | 0.02 | |
| 40 - 49 | - | 2 | 10 | 12 | - | - | 0.01 | 0.02 | |
| 50 - 59 | - | 3 | 12 | 15 | - | - | 0.01 | 0.02 | |
| 60 - 69 | - | 4 | 10 | 14 | - | 0.01 | 0.02 | 0.02 | |
| 70 & over | 1 | 11 | 26 | 38 | - | 0.01 | 0.03 | 0.05 | |
| Total 1 | 1 | 29 | 94 | 126 | - | 0.01 | 0.02 | 0.02 | |
| Child 0-15 | - | 4 | 15 | 19 | - | - | 0.02 | 0.02 | |
| Adult 16+ | 1 | 25 | 80 | 107 | - | 0.01 | 0.02 | 0.02 | |
| Light goods | 0 - 4 | - | - | 1 | 1 | - | - | - | - |
| 5 - 11 | - | - | 2 | 2 | - | - | - | - | |
| 12 - 15 | - | - | 1 | 1 | - | - | - | - | |
| 16 - 22 | - | 3 | 13 | 17 | - | 0.01 | 0.03 | 0.04 | |
| 23-25 | - | 2 | 13 | 16 | - | 0.01 | 0.07 | 0.08 | |
| 26-29 | - | 5 | 18 | 23 | - | 0.02 | 0.06 | 0.08 | |
| 30 - 39 | 1 | 12 | 39 | 51 | - | 0.02 | 0.06 | 0.07 | |
| 40 - 49 | - | 9 | 25 | 34 | - | 0.01 | 0.04 | 0.05 | |
| 50 - 59 | 1 | 7 | 25 | 33 | - | 0.01 | 0.03 | 0.04 | |
| 60 - 69 | 1 | 5 | 9 | 15 | - | 0.01 | 0.01 | 0.02 | |
| 70 & over | - | 1 | 2 | 3 | - | - | - | - | |
| Total 1 | 4 | 44 | 148 | 196 | - | 0.01 | 0.03 | 0.04 | |
| Child 0-15 | - | - | 4 | 4 | - | - | - | - | |
| Adult 16+ | 4 | 44 | 144 | 192 | - | 0.01 | 0.03 | 0.04 | |
1. Includes those whose age was 'not known'
Table 32 (continued): Reported casualties by age and severity, separately for each mode of transport
Numbers and rates per thousand population
Years: 2019-2023 average
| Road User | Age group | Killed | Adjusted serious | Adjusted slight | All Severities | Killed | Adjusted serious | Adjusted slight | All Severities |
|---|---|---|---|---|---|---|---|---|---|
| numbers | rates per thousand population | ||||||||
| Heavy goods | 0 - 4 | - | - | - | - | - | - | - | - |
| 5 - 11 | - | - | - | - | - | - | - | - | |
| 12 - 15 | - | - | - | - | - | - | - | - | |
| 16 - 22 | - | - | 1 | 2 | - | - | - | - | |
| 23-25 | - | - | - | 1 | - | - | - | - | |
| 26-29 | - | 1 | 2 | 3 | - | - | 0.01 | 0.01 | |
| 30 - 39 | - | 2 | 4 | 6 | - | - | 0.01 | 0.01 | |
| 40 - 49 | - | 3 | 6 | 10 | - | - | 0.01 | 0.01 | |
| 50 - 59 | 1 | 5 | 9 | 15 | - | 0.01 | 0.01 | 0.02 | |
| 60 - 69 | - | 2 | 3 | 5 | - | - | - | 0.01 | |
| 70 & over | - | - | - | - | - | - | - | - | |
| Total 1 | 2 | 13 | 26 | 42 | - | - | - | 0.01 | |
| Child 0-15 | - | - | 1 | 1 | - | - | - | - | |
| Adult 16+ | 2 | 13 | 25 | 41 | - | - | 0.01 | 0.01 | |
| Other | 0 - 4 | - | - | - | - | - | - | - | - |
| 5 - 11 | - | 2 | 2 | 4 | - | - | - | 0.01 | |
| 12 - 15 | - | 2 | 1 | 4 | - | 0.01 | 0.01 | 0.02 | |
| 16 - 22 | - | 3 | 7 | 10 | - | 0.01 | 0.01 | 0.02 | |
| 23-25 | - | 1 | 3 | 5 | - | 0.01 | 0.01 | 0.02 | |
| 26-29 | - | 3 | 3 | 6 | - | 0.01 | 0.01 | 0.02 | |
| 30 - 39 | - | 7 | 10 | 17 | - | 0.01 | 0.01 | 0.02 | |
| 40 - 49 | - | 3 | 8 | 12 | - | - | 0.01 | 0.02 | |
| 50 - 59 | - | 4 | 10 | 15 | - | 0.01 | 0.01 | 0.02 | |
| 60 - 69 | - | 3 | 4 | 7 | - | - | 0.01 | 0.01 | |
| 70 & over | 1 | 3 | 2 | 7 | - | - | - | 0.01 | |
| Total 1 | 2 | 32 | 51 | 86 | - | 0.01 | 0.01 | 0.02 | |
| Child 0-15 | - | 4 | 3 | 8 | - | - | - | 0.01 | |
| Adult 16+ | 2 | 28 | 47 | 78 | - | 0.01 | 0.01 | 0.02 | |
| Total | 0 - 4 | 1 | 18 | 62 | 82 | 0.01 | 0.07 | 0.24 | 0.32 |
| 5 - 11 | 1 | 74 | 193 | 270 | - | 0.18 | 0.47 | 0.66 | |
| 12 - 15 | 2 | 83 | 148 | 234 | 0.01 | 0.35 | 0.62 | 0.99 | |
| 16 - 22 | 14 | 240 | 548 | 808 | 0.03 | 0.54 | 1.24 | 1.83 | |
| 23-25 | 7 | 96 | 246 | 351 | 0.03 | 0.47 | 1.21 | 1.73 | |
| 26-29 | 8 | 122 | 302 | 436 | 0.03 | 0.44 | 1.10 | 1.58 | |
| 30 - 39 | 22 | 269 | 668 | 965 | 0.03 | 0.38 | 0.95 | 1.37 | |
| 40 - 49 | 19 | 228 | 519 | 772 | 0.03 | 0.34 | 0.77 | 1.15 | |
| 50 - 59 | 22 | 298 | 531 | 858 | 0.03 | 0.37 | 0.66 | 1.07 | |
| 60 - 69 | 22 | 197 | 320 | 542 | 0.03 | 0.29 | 0.47 | 0.80 | |
| 70 & over | 36 | 228 | 281 | 549 | 0.05 | 0.30 | 0.37 | 0.72 | |
| Total 1 | 154 | 1,854 | 3,821 | 5,871 | 0.03 | 0.34 | 0.70 | 1.08 | |
| Child 0-15 | 4 | 175 | 403 | 585 | - | 0.19 | 0.45 | 0.65 | |
| Adult 16+ | 150 | 1,679 | 3,415 | 5,282 | 0.03 | 0.37 | 0.75 | 1.16 | |
1. Includes those whose age was 'not known'
< Previous | Contents | Next >