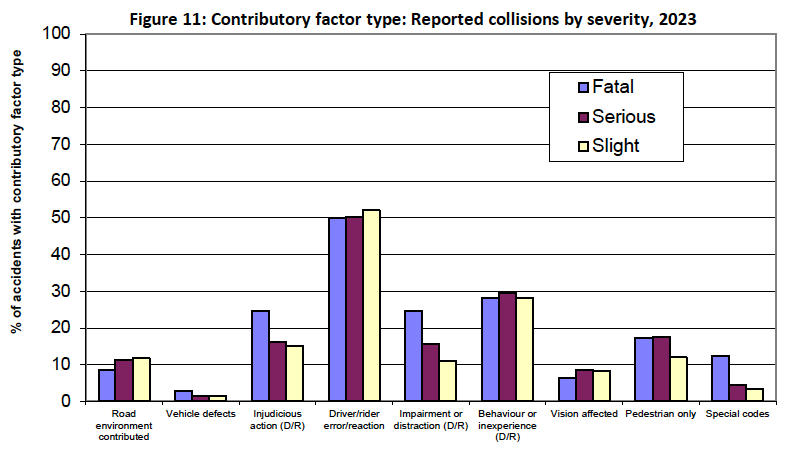
Table M: Contributory Factors: Reported collisions1 by severity, 2023
Table M: Contributory Factors: Reported collisions1 by severity, 2023
| Contributory factor reported in collision 2 | Fatal | Serious | Slight | All collisions | ||||
|---|---|---|---|---|---|---|---|---|
| Number | Per cent3 | Number | Per cent3 | Number | Per cent3 | Number | Per cent3 | |
| Road environment contributed | 12 | 9 | 167 | 11 | 210 | 12 | 389 | 11 |
| Vehicle defects | 4 | 3 | 23 | 2 | 27 | 2 | 54 | 2 |
| Injudicious action (D/R) | 34 | 25 | 239 | 16 | 270 | 15 | 543 | 16 |
| Driver/rider error/reaction | 69 | 50 | 734 | 50 | 926 | 52 | 1,729 | 51 |
| Impairment or distraction (D/R) | 34 | 25 | 229 | 16 | 198 | 11 | 461 | 14 |
| Behaviour or inexperience (D/R) | 39 | 28 | 433 | 30 | 500 | 28 | 972 | 29 |
| Vision affected | 9 | 7 | 127 | 9 | 148 | 8 | 284 | 8 |
| Pedestrian only | 24 | 17 | 259 | 18 | 213 | 12 | 496 | 15 |
| Special codes | 17 | 12 | 65 | 4 | 60 | 3 | 142 | 4 |
| Total reported collisions1 | 138 | 100% | 1,466 | 100% | 1,780 | 100% | 3,384 | 100% |
| Number of Contributory Factors4 | 285 | 2,722 | 2,969 | 5,976 | ||||
| Average number of CFs per collision1,2 | 2.1 | 1.9 | 1.7 | 1.8 | ||||
1 Includes only collisions where a police officer attended the scene and in which a contributory factor was reported
2 collisions with more than one CF in a category are only counted once in the category total.
3 Columns won't sum to 100 per cent as collisions can have more than one CF
4 Includes all contributory factors eg if two cars are involved in the same collision and both are exceeding the speed limit this would count as 2 CFs.
< Previous | Contents | Next >