Summary transport statistics
Introduction
This chapter highlights some of the main findings from Scottish Transport Statistics, the accompanying summary tables provide longer term trends than those included in the individual chapters and include comparisons between Scotland and Great Britain. This publication covers data up until 2023-24.
The content of this chapter
This chapter covers the following topics:
- Overview of travel in Scotland
- Motor vehicles, traffic and road casualties
- Public transport: bus, rail, air and ferry
- Personal travel (e.g. driving, walking and cycling; travel to work and school)
- Cross-border transport
- Environment and emissions
Overview of travel in Scotland
Transport and travel habits in Scotland were profoundly affected by the Covid-19 pandemic, with restrictions on travel and daily activity in place for large parts of 2020 and some of 2021.
In 2023-24, public transport journeys rose by 15%, with 451 million public transport journeys made by either bus, rail, air, or ferry. This compares with the 392 million public transport journeys recorded in 2022-23.
Bus remained by far the most commonly used form of public transport in 2023-24, with 74% of public transport journeys made by bus, 18% by rail, 6% by air and 2% by ferry.
The number of bus journeys increased by 12% in 2023-24 compared to 2022-23. However, this was still 7% lower than pre-pandemic journeys in 2019-20. Prior to this, bus passenger numbers had been following a generally declining trend, dropping by 10% in the ten years leading up to 2019-20.
Rail journeys showed an increase of 27% over the year 2023-24. However, this was still 16% lower than in 2019-20. In the years immediately prior to the pandemic rail use had been steadily increasing.
Air passengers increased by 21% between 2022 and 2023, but are still down by around 10% compared with 2019. Air passenger numbers had increased by 28% in the ten years prior to the pandemic. Ferry passenger numbers showed an increase of 4% in 2023, but were still down 7% compared to 2019.
Road traffic also rose in 2023-24. Overall road traffic increased by 2%, and has now returned to 99% of pre-pandemic levels. Car traffic increased by 3% in 2023-24 and is now 4% below pre-pandemic levels. Prior to the pandemic, road traffic had been following a steadily increasing trend with total road traffic increasing by 10% in the 10 years up to 2019.
During the pandemic cycling was one of the few transport types to demonstrate an increase in traffic volume. Despite decreases in the years since, cycling on the road network was estimated to be 10% higher in 2023-24 compared with 2019-20.
The table below shows changes in the numbers and percentage changes for various forms of transport.
| 2019-20 | 2022-23 | 2023-24 | Change over 1 year | Change since 2019-20 | |
|---|---|---|---|---|---|
| Car Traffic (million/veh km) | 36,678 | 34,375 | 35,372 | +3% | -4% |
| Pedal Cycle Traffic (on-road) (million/veh km) | 365 | 422 | 403 | -5% | 10% |
| ScotRail Passengers (millions) | 96.4 | 63.7 | 81.2 | +27% | -16% |
| Bus Passengers (millions) | 361 | 297 | 334 | +12% | -7% |
| Air Passengers (millions) | 29 | 21.5 | 26.0 | +21% | -10% |
| Ferry Passengers (millions) | 10.4 | 9.3 | 9.7 | +4% | -7% |
Source: STS 2024, Table S1 except Traffic estimates from table 5.3.
Motor vehicles, traffic and road casualties
Motor vehicles
There were 3.1 million motor vehicles licensed in Scotland in 2023. Having increased slightly from 2022, this is the highest level recorded [Figure 1].
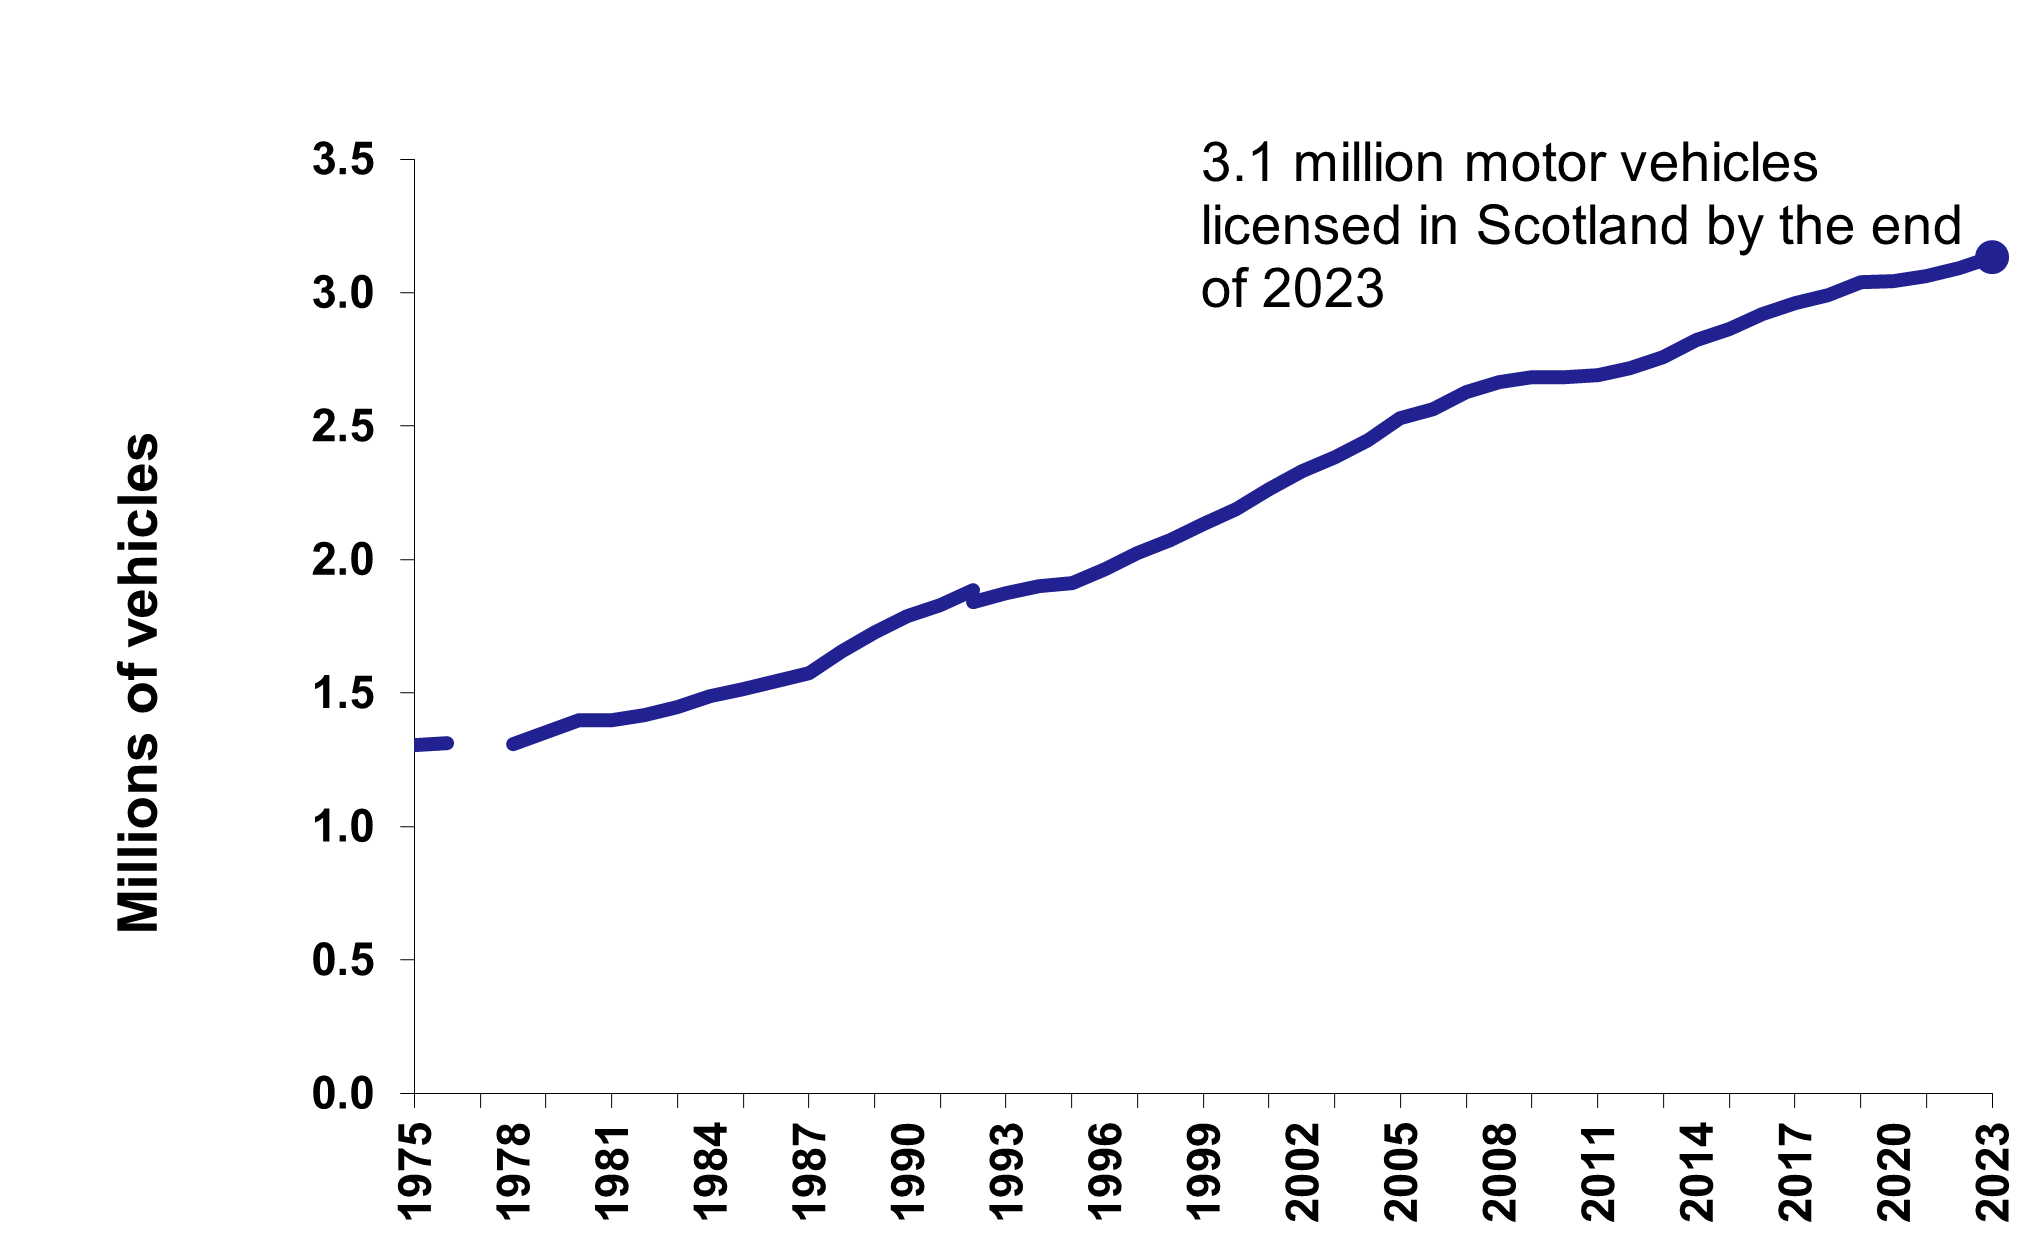
The total number of vehicles registered in Scotland has been increasing steadily over the longer term. The current total is 14% higher than in 2013 and has more than tripled since 1964.
The number of new vehicle registrations in 2023 was 205,000. Whilst this was 14% higher than in 2022, it was still below the figure for 2019 (221,000), which itself was the third successive annual decrease. Taken together, the trends in total vehicles registrations and new vehicle registrations suggests that in recent years people have been buying fewer new vehicles, but retaining existing vehicles for longer.
There were fewer vehicles per person in Scotland than in Great Britain as a whole (56 compared to 60 per hundred population), as has consistently been the case in recent years.
The road network
There were 57,327 kilometres of public road in Scotland in 2023. Seven per cent of this was trunk road, which is managed centrally by Transport Scotland; the remaining roads are the responsibility of Local Authorities.
In Scotland, there was 10.4 kilometres of road per 1,000 people, compared to 6.0 km per 1,000 people in GB as a whole.
Road traffic
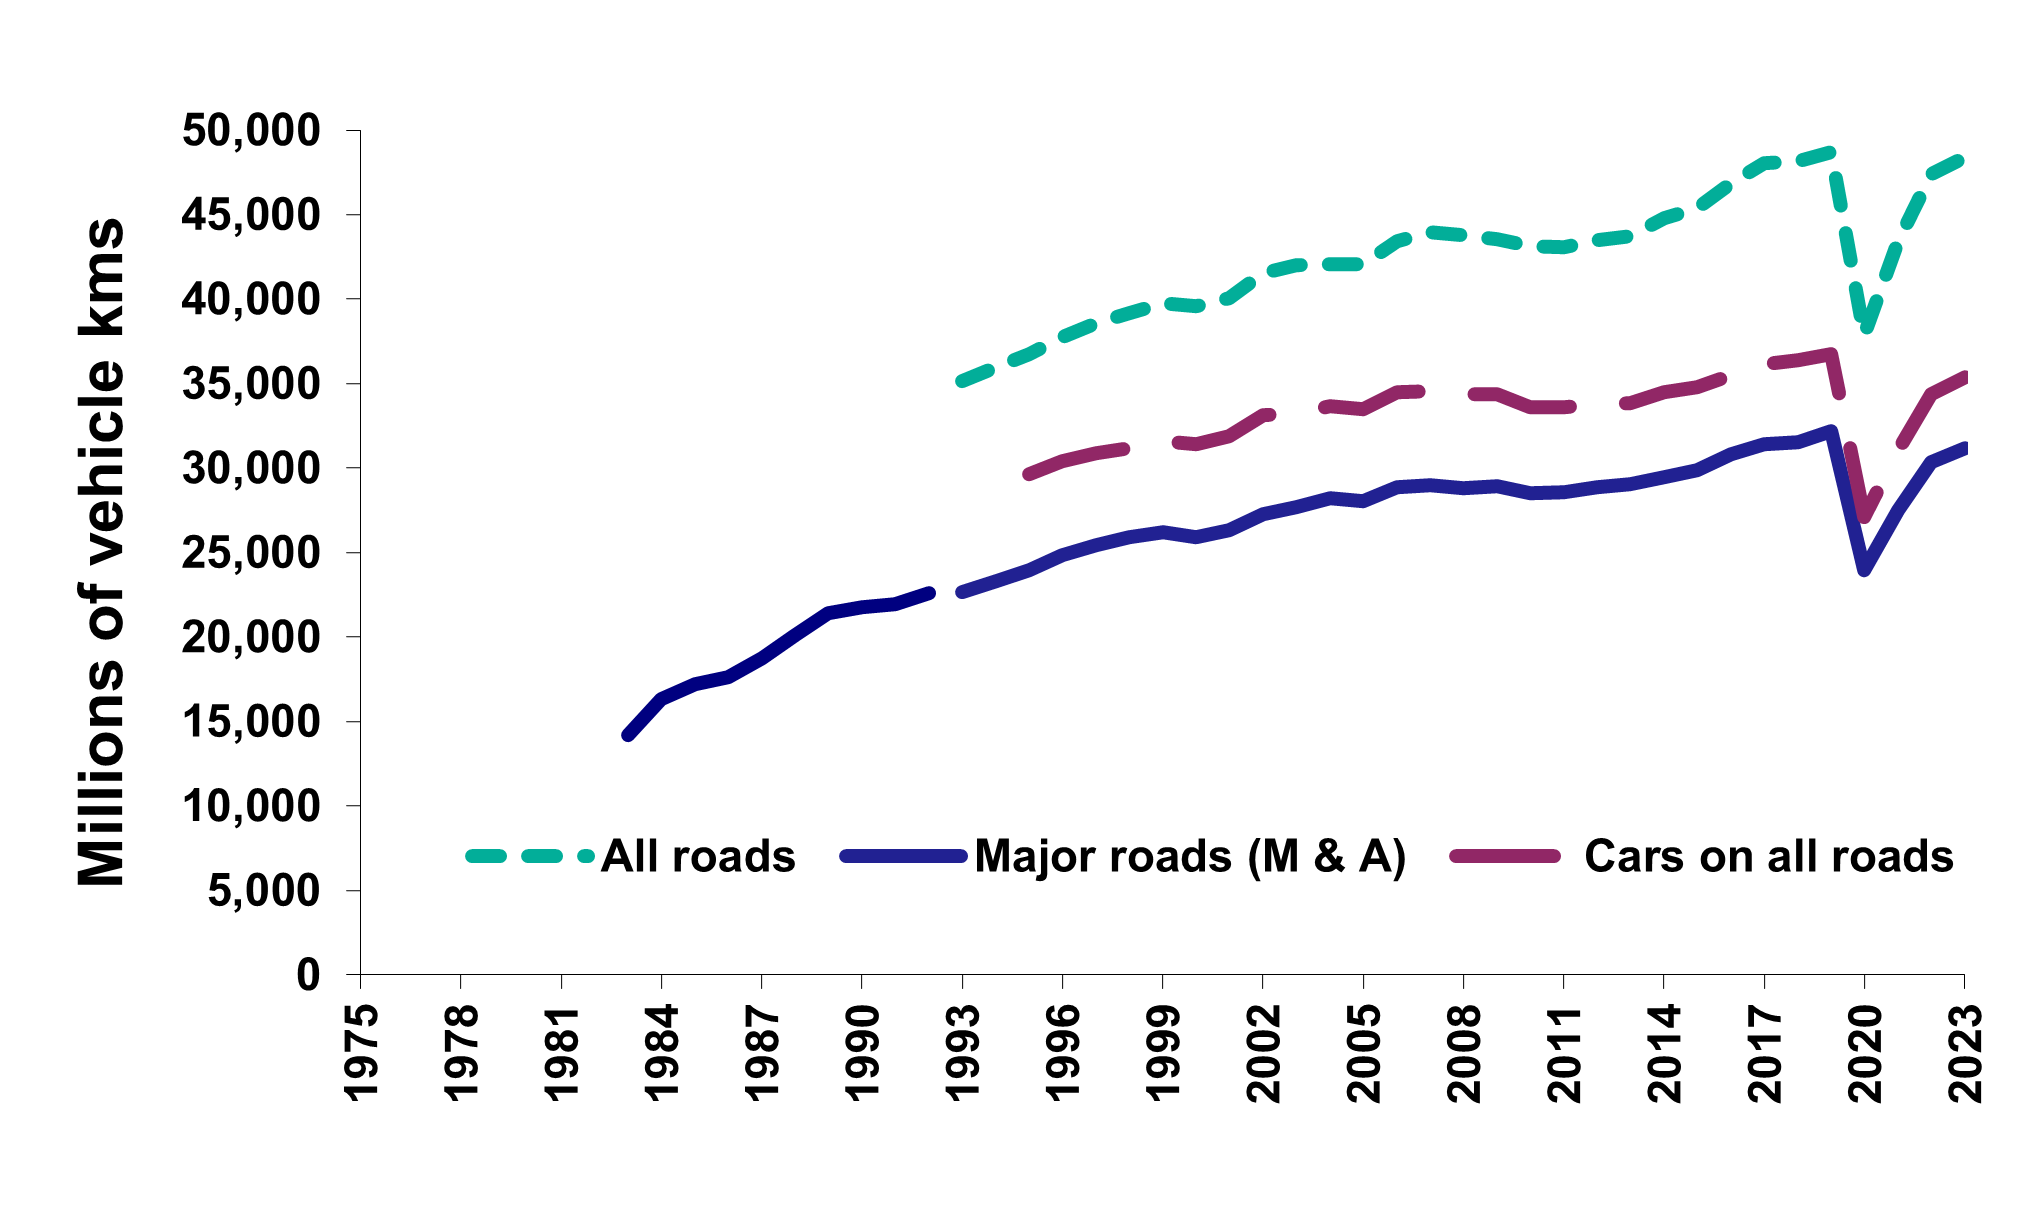
In 2023, 48.4 billion vehicle kilometres were travelled, an increase of 2% compared to the previous year, but 1% less than in 2019.
Prior to the pandemic, the volume of traffic on major roads (Motorways and A roads) had more than doubled since 1983, from an estimated 14,185 million vehicle kilometres to around 32,000 million vehicle kilometres in 2019 [Figure 2].
Car and van users reported that 12% of journeys were delayed due to traffic congestion in 2023.
Road casualties
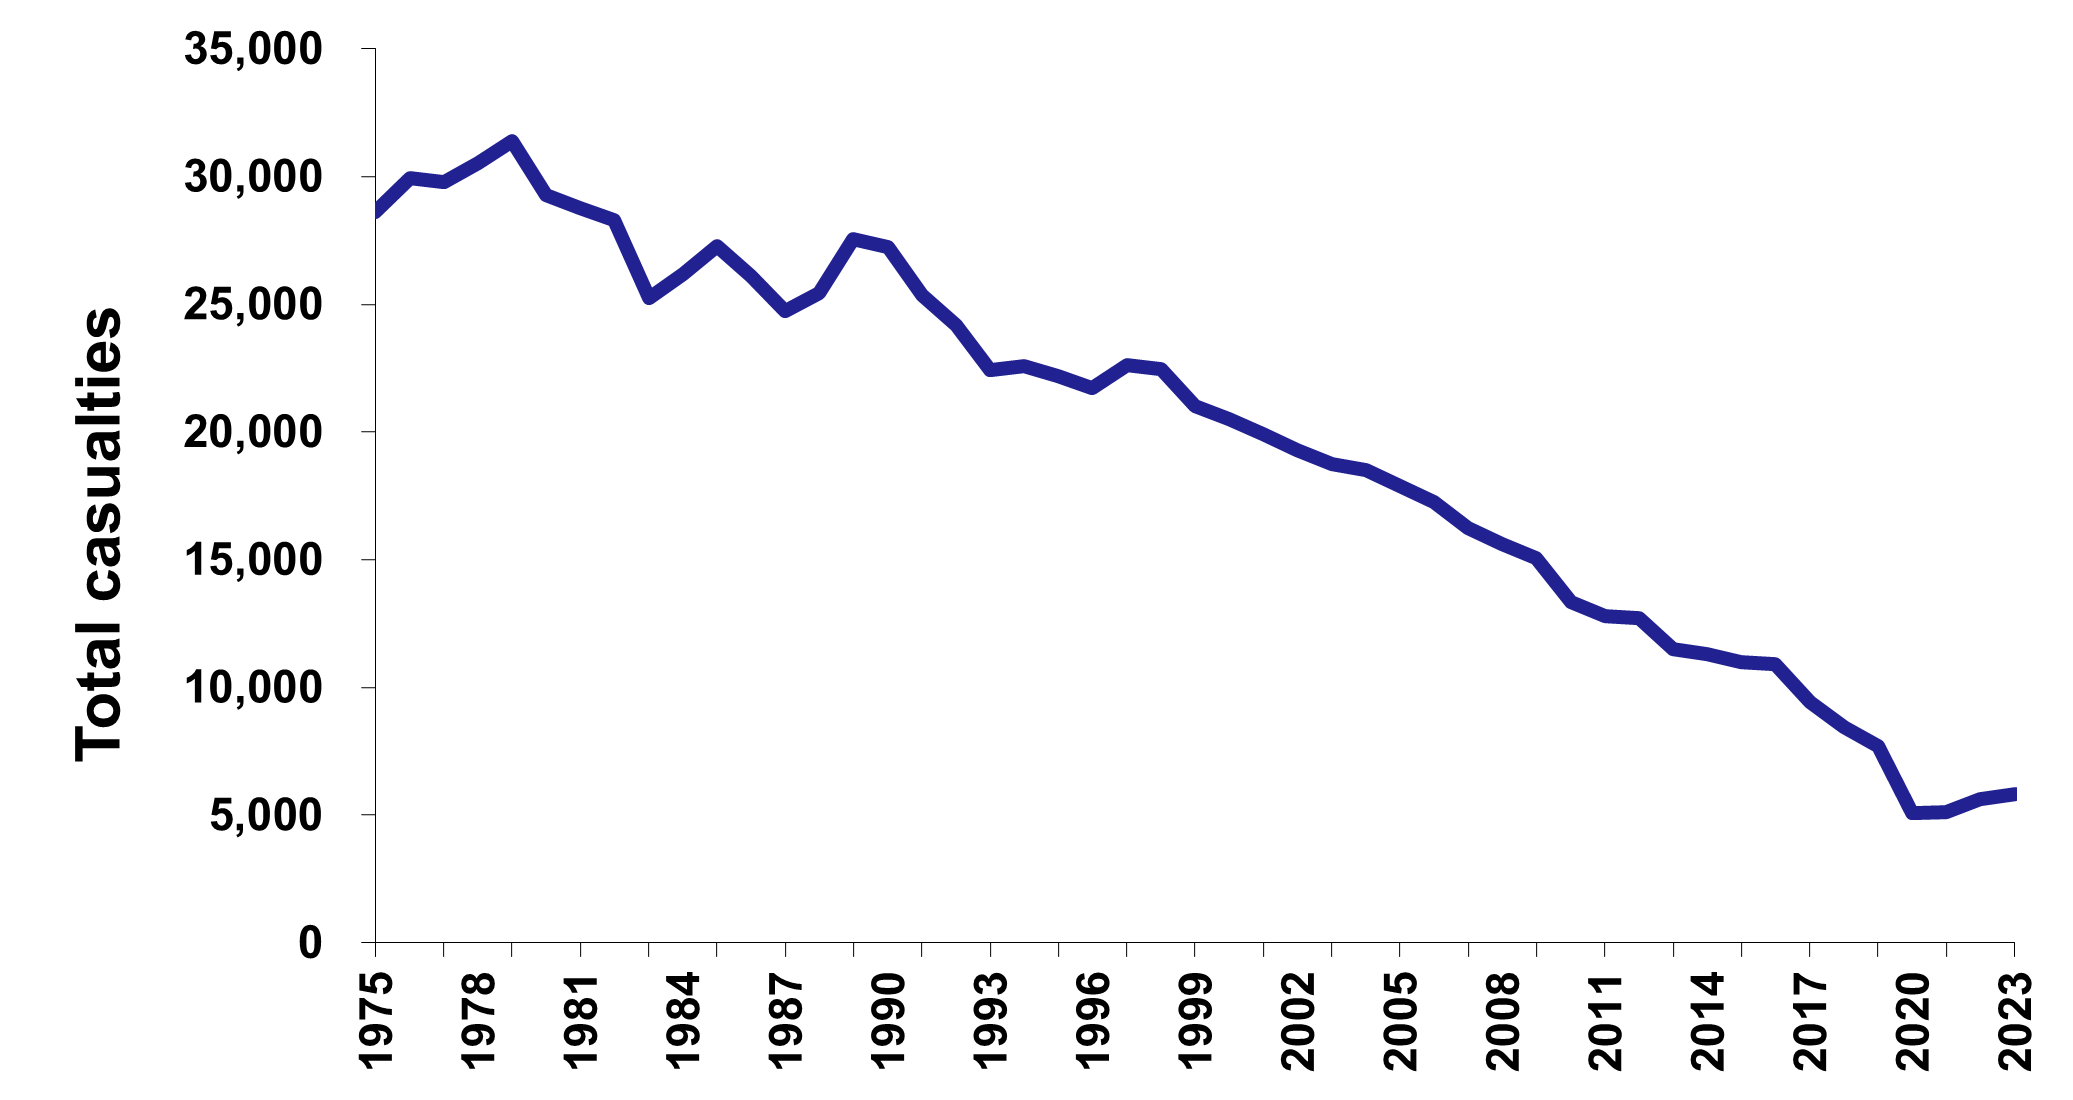
In 2023, 155 people were killed and 1,944 seriously injured in road collisions.
The total number of casualties on Scottish roads rose 4% between 2022 and 2023. These latest figures will have been influenced by the latest increase in traffic. However, prior to the pandemic recorded casualties were declining [Figure 3]. The total number of road casualties decreased by 49% over the last decade. Casualties of all severities have fallen over this period.
In Scotland in 2023, for every thousand people in the population, 0.38 were killed or seriously injured in road collisions, compared to 0.45 for Great Britain.
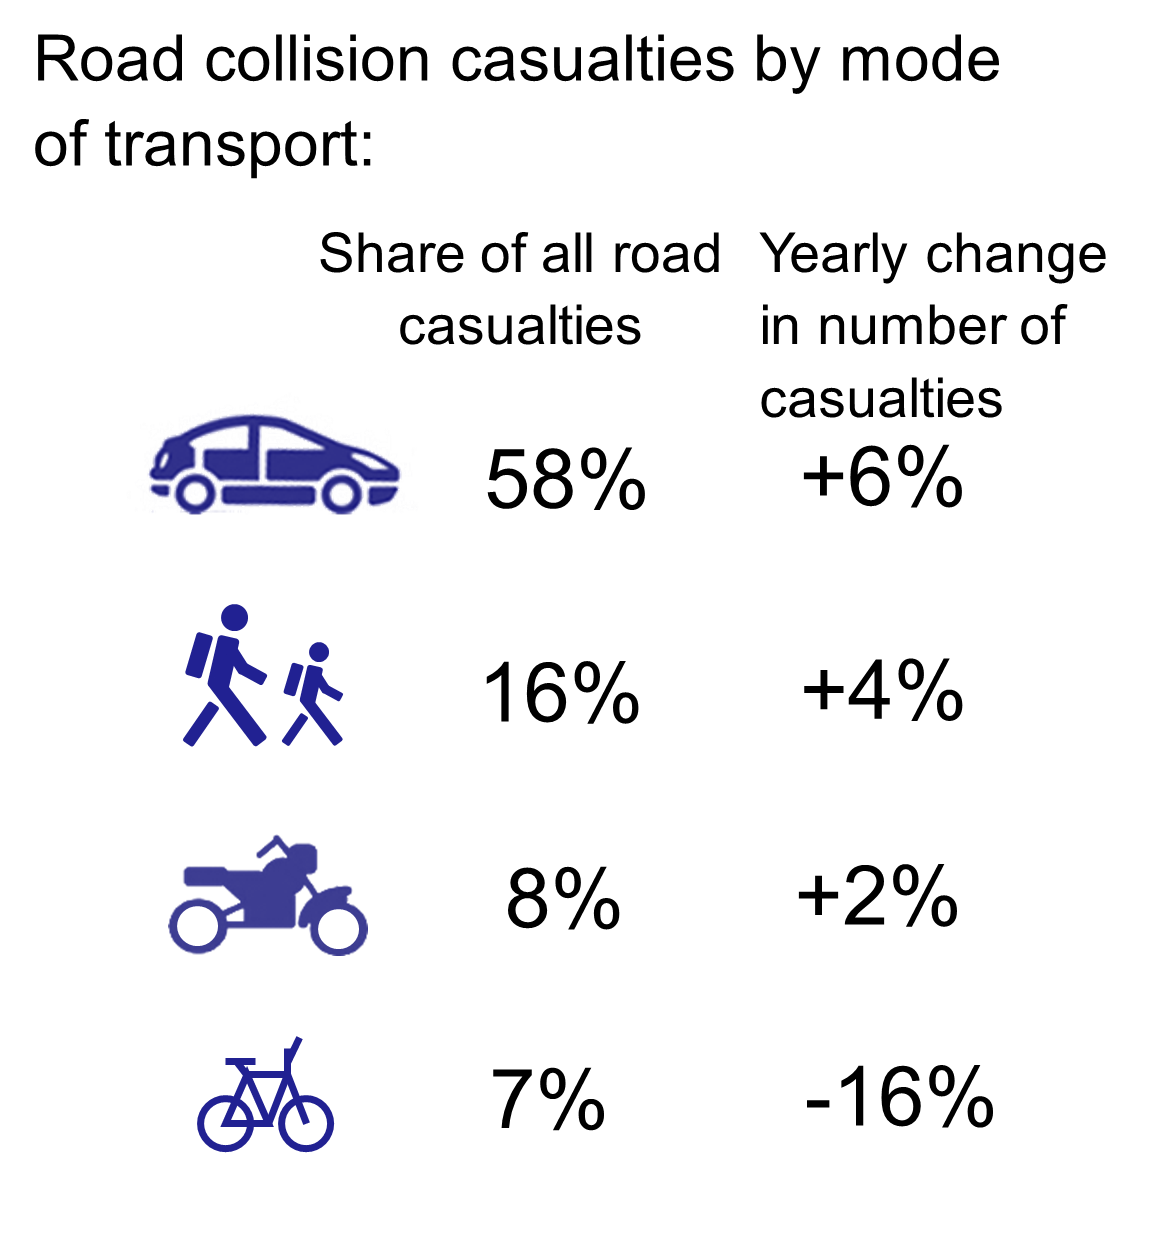
In 2023, car users accounted for almost three fifths of all casualties (58%), with car casualties increasing by 6% and pedestrian casualties increasing by 4% in 2023 [Figure 4].
Public transport: bus, rail, air and ferry
Local bus and rail services
Bus
Bus travel in Scotland was profoundly affected by the Covid-19 pandemic, with restrictions on travel and daily activity in place for large parts of 2020 and some of 2021.
In 2023, there were 334 million bus passenger journeys, an increase of 13% on the previous year [Figure 5]. Just over one half of all bus journeys in 2023 were made under the National Concessionary Travel scheme. This compares with 38% of journeys in 2019, although in early 2022 the scheme was expanded to include those aged under 22.
Prior to the pandemic, bus passenger journeys had been falling over the longer term. The figures almost halved between 1960 and 1975 and roughly halved again by 2019.
The distance covered by local bus services (expressed in terms of ‘vehicle kilometres’) can be seen as a measure of bus service provision. Although this was the same in 2023 as the previous year, the number of passengers carried still rose by 13%.
Rail
Rail travel in Scotland was profoundly affected by the Covid-19 pandemic, with restrictions on travel and daily activity in place for large parts of 2020 and some of 2021.
There were 81.2 million ScotRail passenger journeys in 2023-24, an increase of 27% from 2022-23 [Figure 5].
Prior to the pandemic, rail patronage had been rising steadily and but it was 6% lower in 2023-24 compared to 2013-14.
The distance covered by scheduled trains in Scotland rose by 13% in 2023-24. However, this was not to the same scale as the increase in passenger numbers (27%).

Air and ferry passengers
Air
There were 26 million air terminal passengers in 2023, up 21% compared to the previous year, but 10% lower than in 2019. Prior to the pandemic, air passenger numbers had been increasing over time, with a 28% increase in the ten years up to 2019 [Figure 6].
In 2023, 3.9% of all terminal passenger traffic was from within Scotland, 35% was to or from other parts of the UK, 54% was between Scotland and mainland Europe.
Ferry
In 2023, 9.7 million passengers travelled by ferry (including traffic within Scotland and to and from Northern Ireland), a 4% increase on the previous year [Figure 6].
Across all ferry routes, 3.4 million vehicles were carried in 2023 (including traffic between Scotland and Northern Ireland and within Scotland), a 12% increase on the 2021.
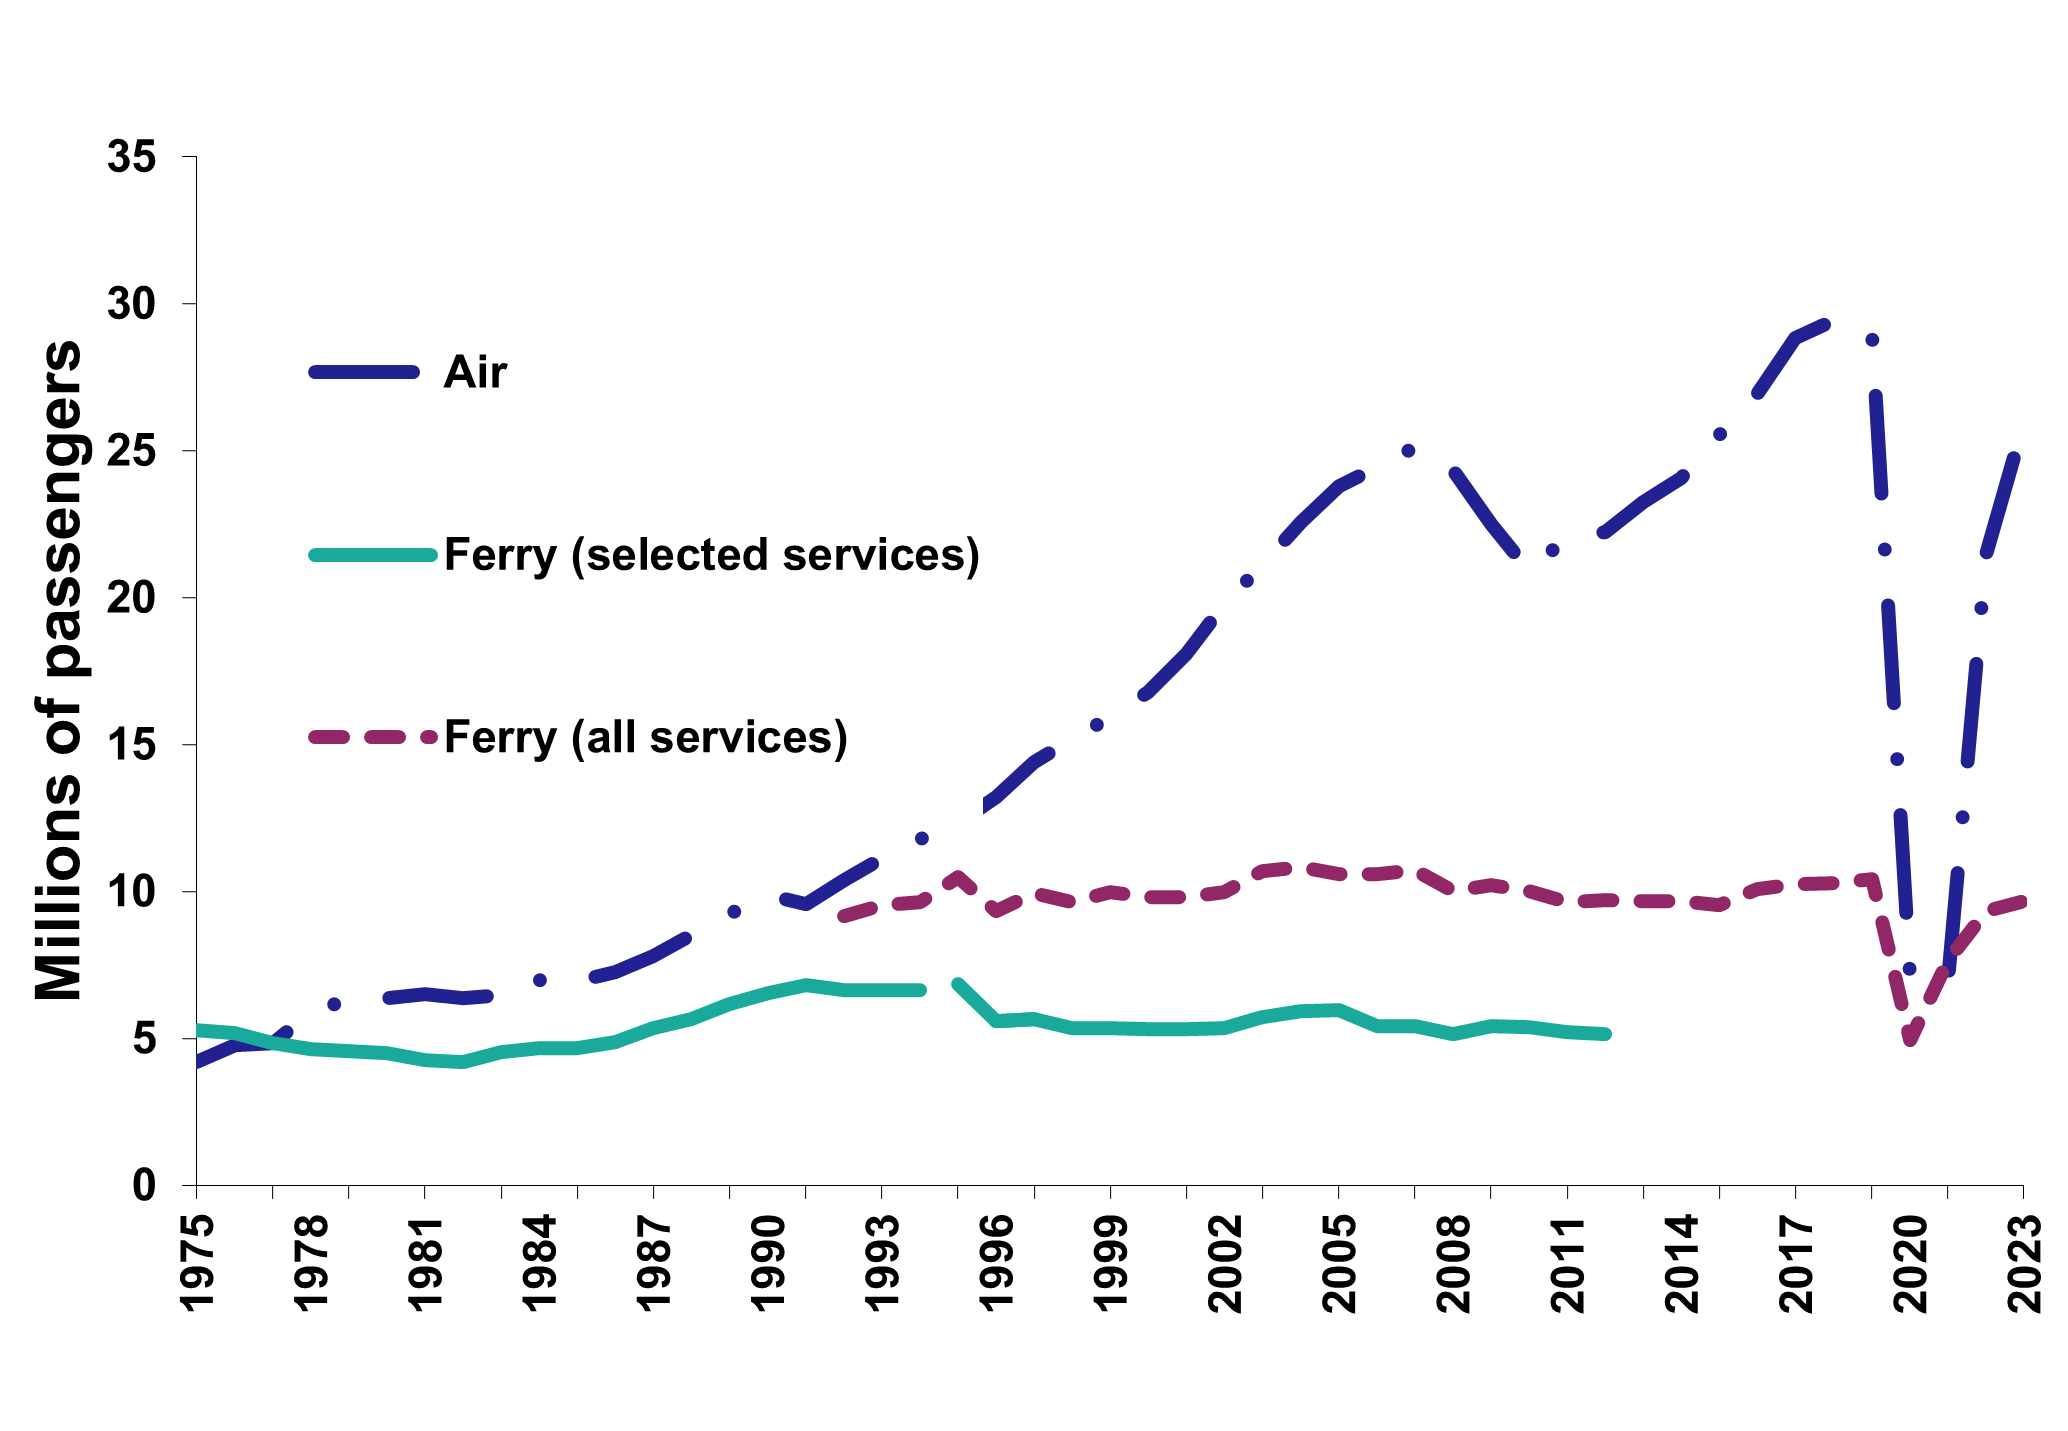
Note: in the above figure, ‘selected services’ refers to those services for which data is available back to 1975 – Caledonian MacBrayne, P&O Scottish Ferries, Northlink Orkney and Shetland Ferries and Orkney Ferries
Personal travel (e.g. driving, walking and cycling; travel to work and school)
In 2023, 71% of people aged 17 or over had a full driving licence. The proportion of men aged 17+ holding a licence was higher than women (77% compared to 67%).
35% of people drove every day in 2023, with around 74% of households having access to at least one car.
Twenty nine per cent of employed people reported that they currently worked from home. This compares with 16% in 2019.
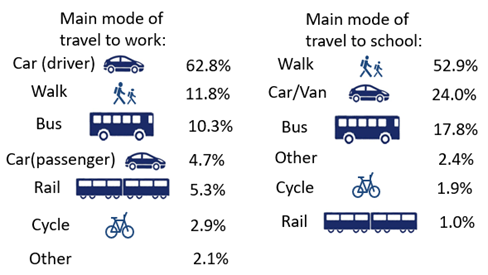
Of those that travelled to work in 2023, 30% of journeys to work were by public or active travel [Figure 7].
Sixty four per cent of people were either very or fairly satisfied with public transport in 2023, a increase from 58% in 2022.
Cross-border transport
As with transport more generally, cross-border transport was significantly affected by the Coronavirus pandemic. In 2023, there were 11 million air and ferry passenger journeys to other parts of the UK, an increase of 19% since 2022. The majority of these journeys were made by air (9 million).
The most recently available figures for cross-border rail journeys are for 2022. These show 18 million passenger journeys were made to other parts of the UK in 2022.
In 2023, 15.6 million passenger journeys were made to and from other countries by air, an increase of 43% since 2013.
Environment and emissions
The most recently available figures for transport emissions relate to 2022.
Transport accounted for 31.7% of Scotland’s total greenhouse gas emissions in 2022. Scotland’s transport emissions in 2022 were 9.1% higher than in 2021, and 13.3% lower than in 1990.
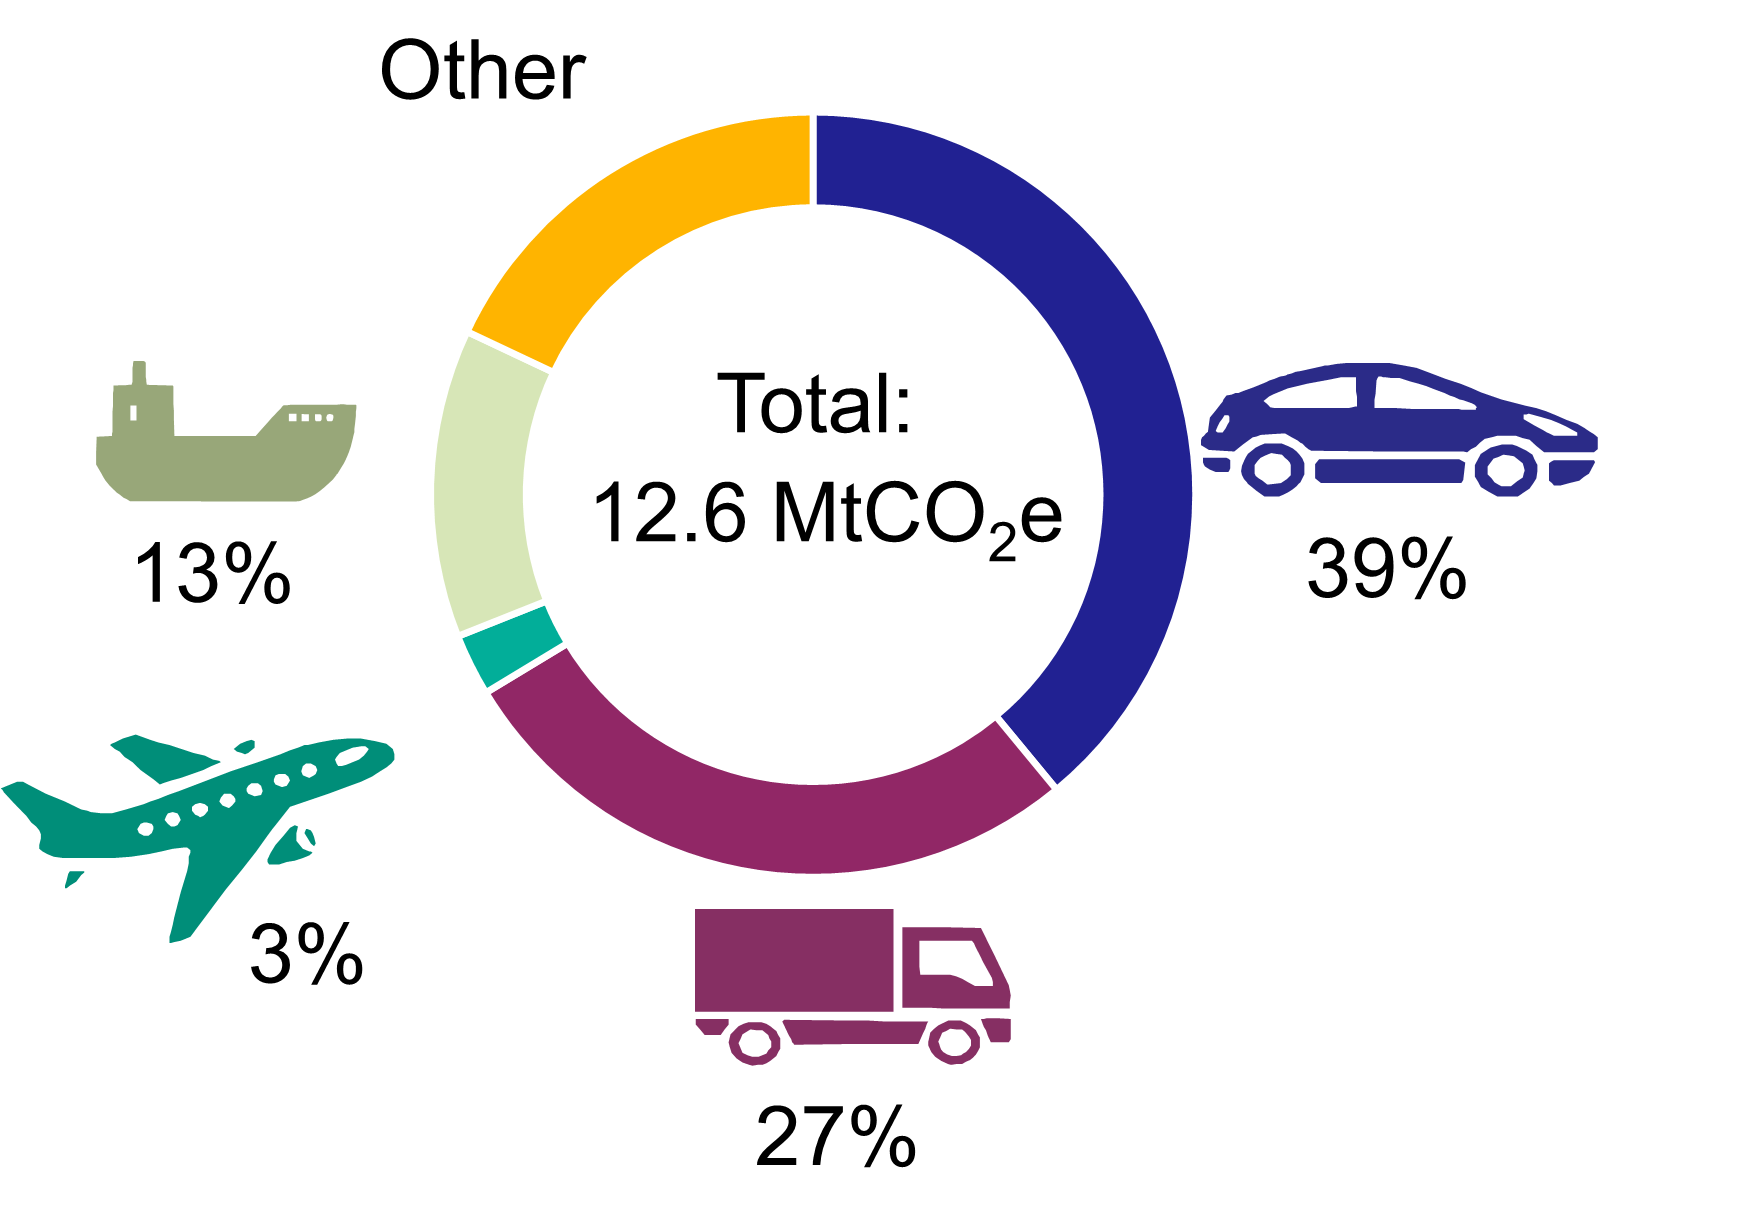
In 2022, passenger cars accounted for 39% of transport greenhouse gas emissions [Figure 8].
Over the longer term, newly registered cars have become more efficient in terms of carbon dioxide emissions, with average CO2 emissions in Scotland for new car registrations falling by 16% over the last ten years.
At the end of 2023, ultra-low emission vehicles (ULEVs) accounted for 2.9% of vehicles licensed in Scotland , an increase from 2.1% at the end of 2022.
Official Statistics
These statistics are official statistics. Official statistics are statistics that are produced by crown bodies, those acting on behalf of crown bodies, or those specified in statutory orders, as defined in the Statistics and Registration Service Act 2007.
Scottish Government statistics are regulated by the Office for Statistics Regulation (OSR). OSR sets the standards of trustworthiness, quality and value in the Code of Practice for Statistics that all producers of official statistics should adhere to.
Data and Methodology
Information on the notes, definitions and sources for each of the chapters in the publication can be found in the individual chapter user guides.
Tell us what you think
We are always interested to hear from our users about how our statistics are used, and how they can be improved.
Feedback survey
We’d appreciate it if you would complete our short feedback survey on this publication.
Enquiries
For enquiries about this publication please contact:
Andrew Knight
Transport Scotland Analytical Services
E-mail: transtat@transport.gov.scot
For general enquiries about Scottish Government statistics please contact:
Office of the Chief Statistician
e-mail: statistics.enquiries@gov.scot
Join our mailing list
If you would like to receive notification about statistical publications, or find out about consultations on our statistics please join the ScotStat mailing list.
Future publications
Details of future publications can be found on our forthcoming publications page.