Appendix A

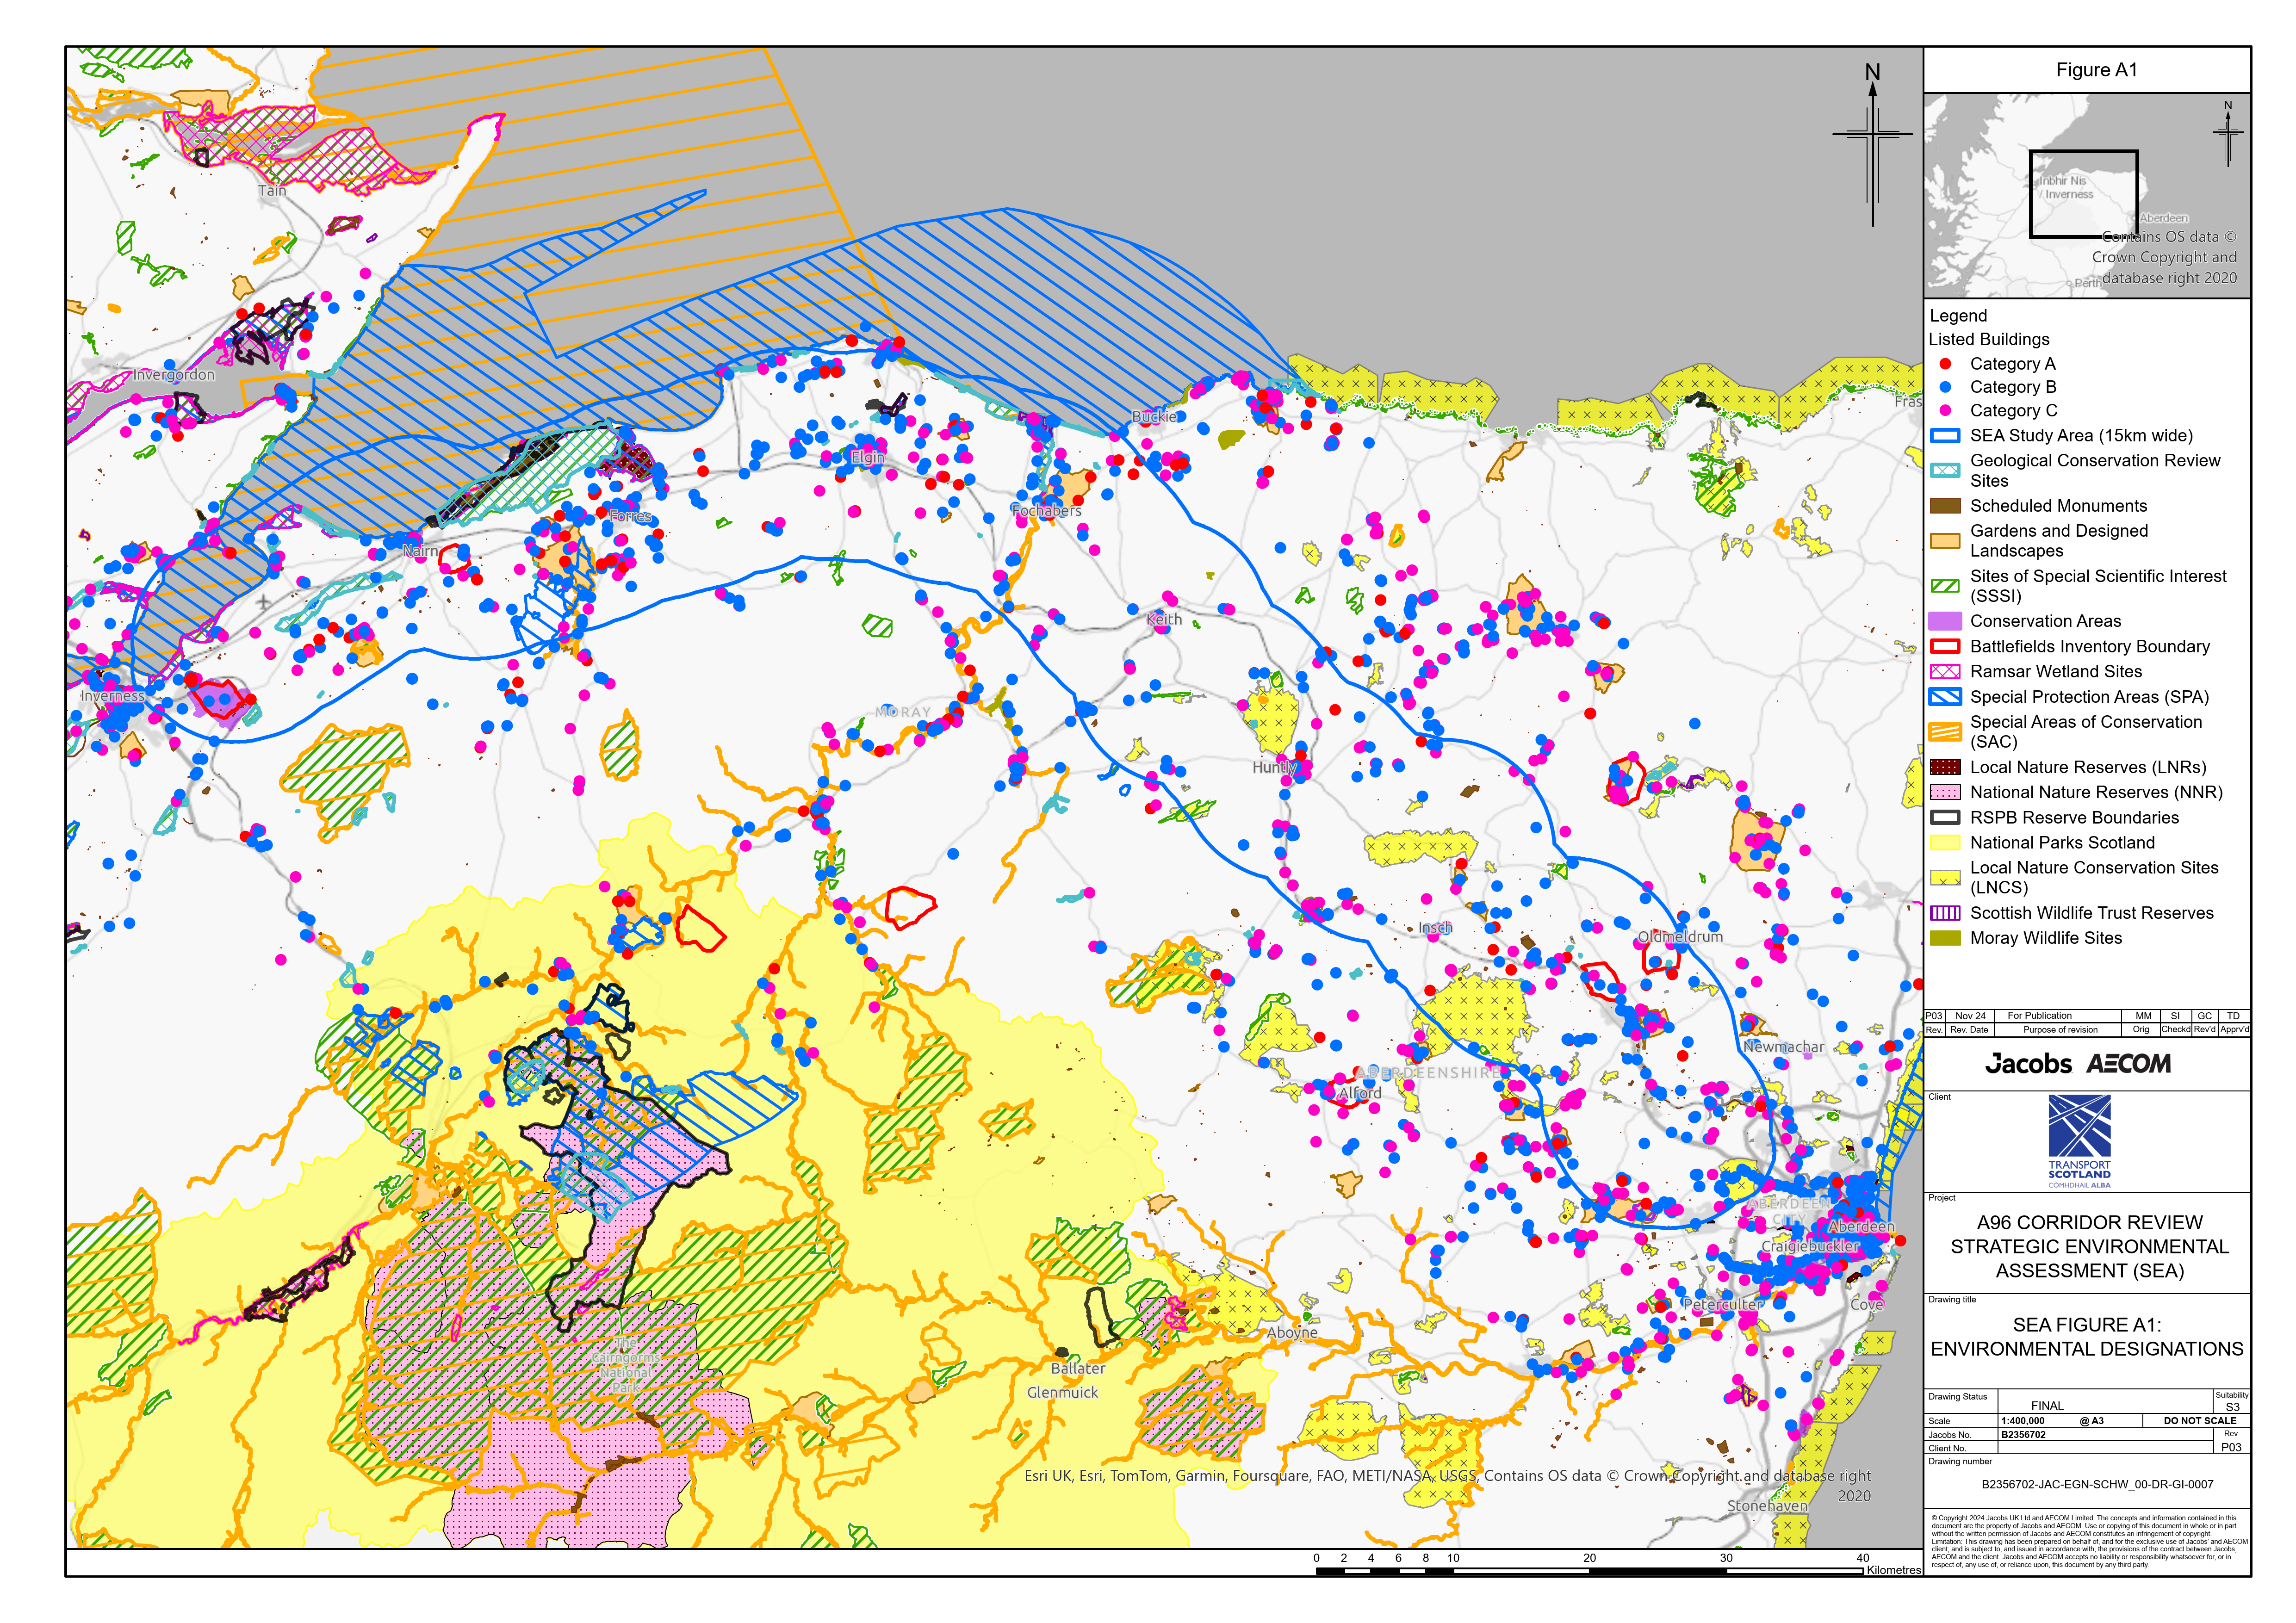
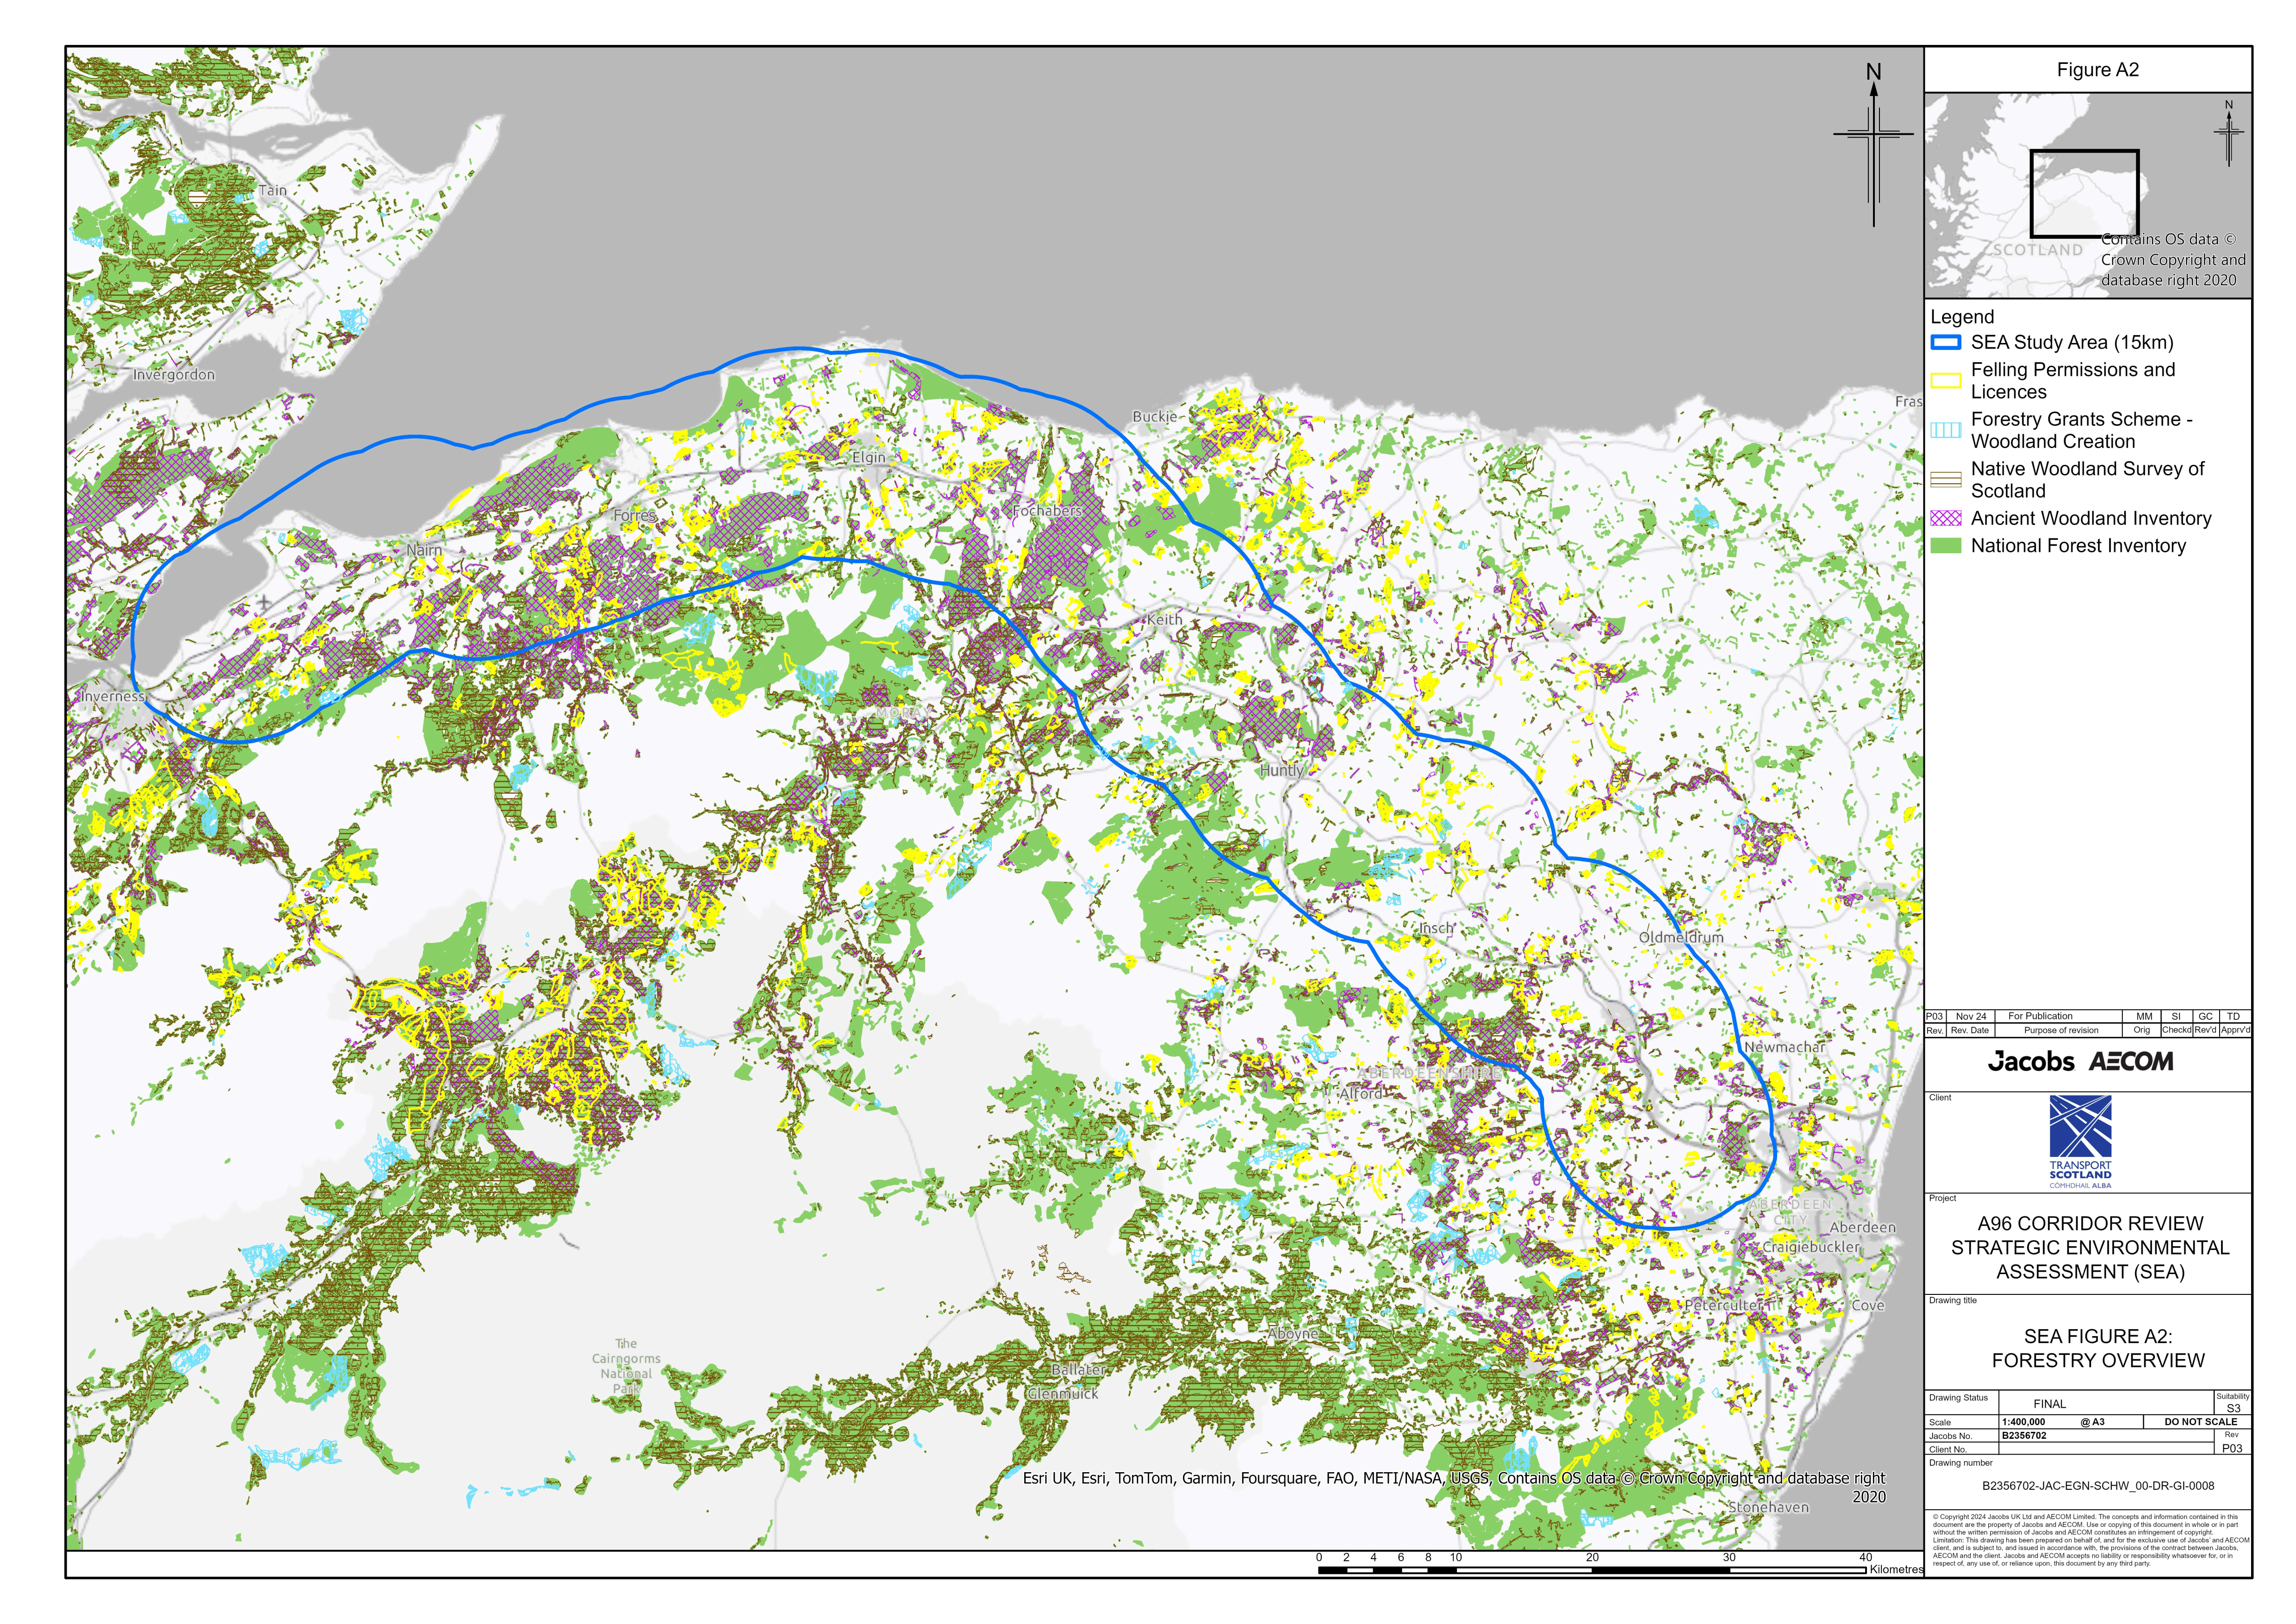
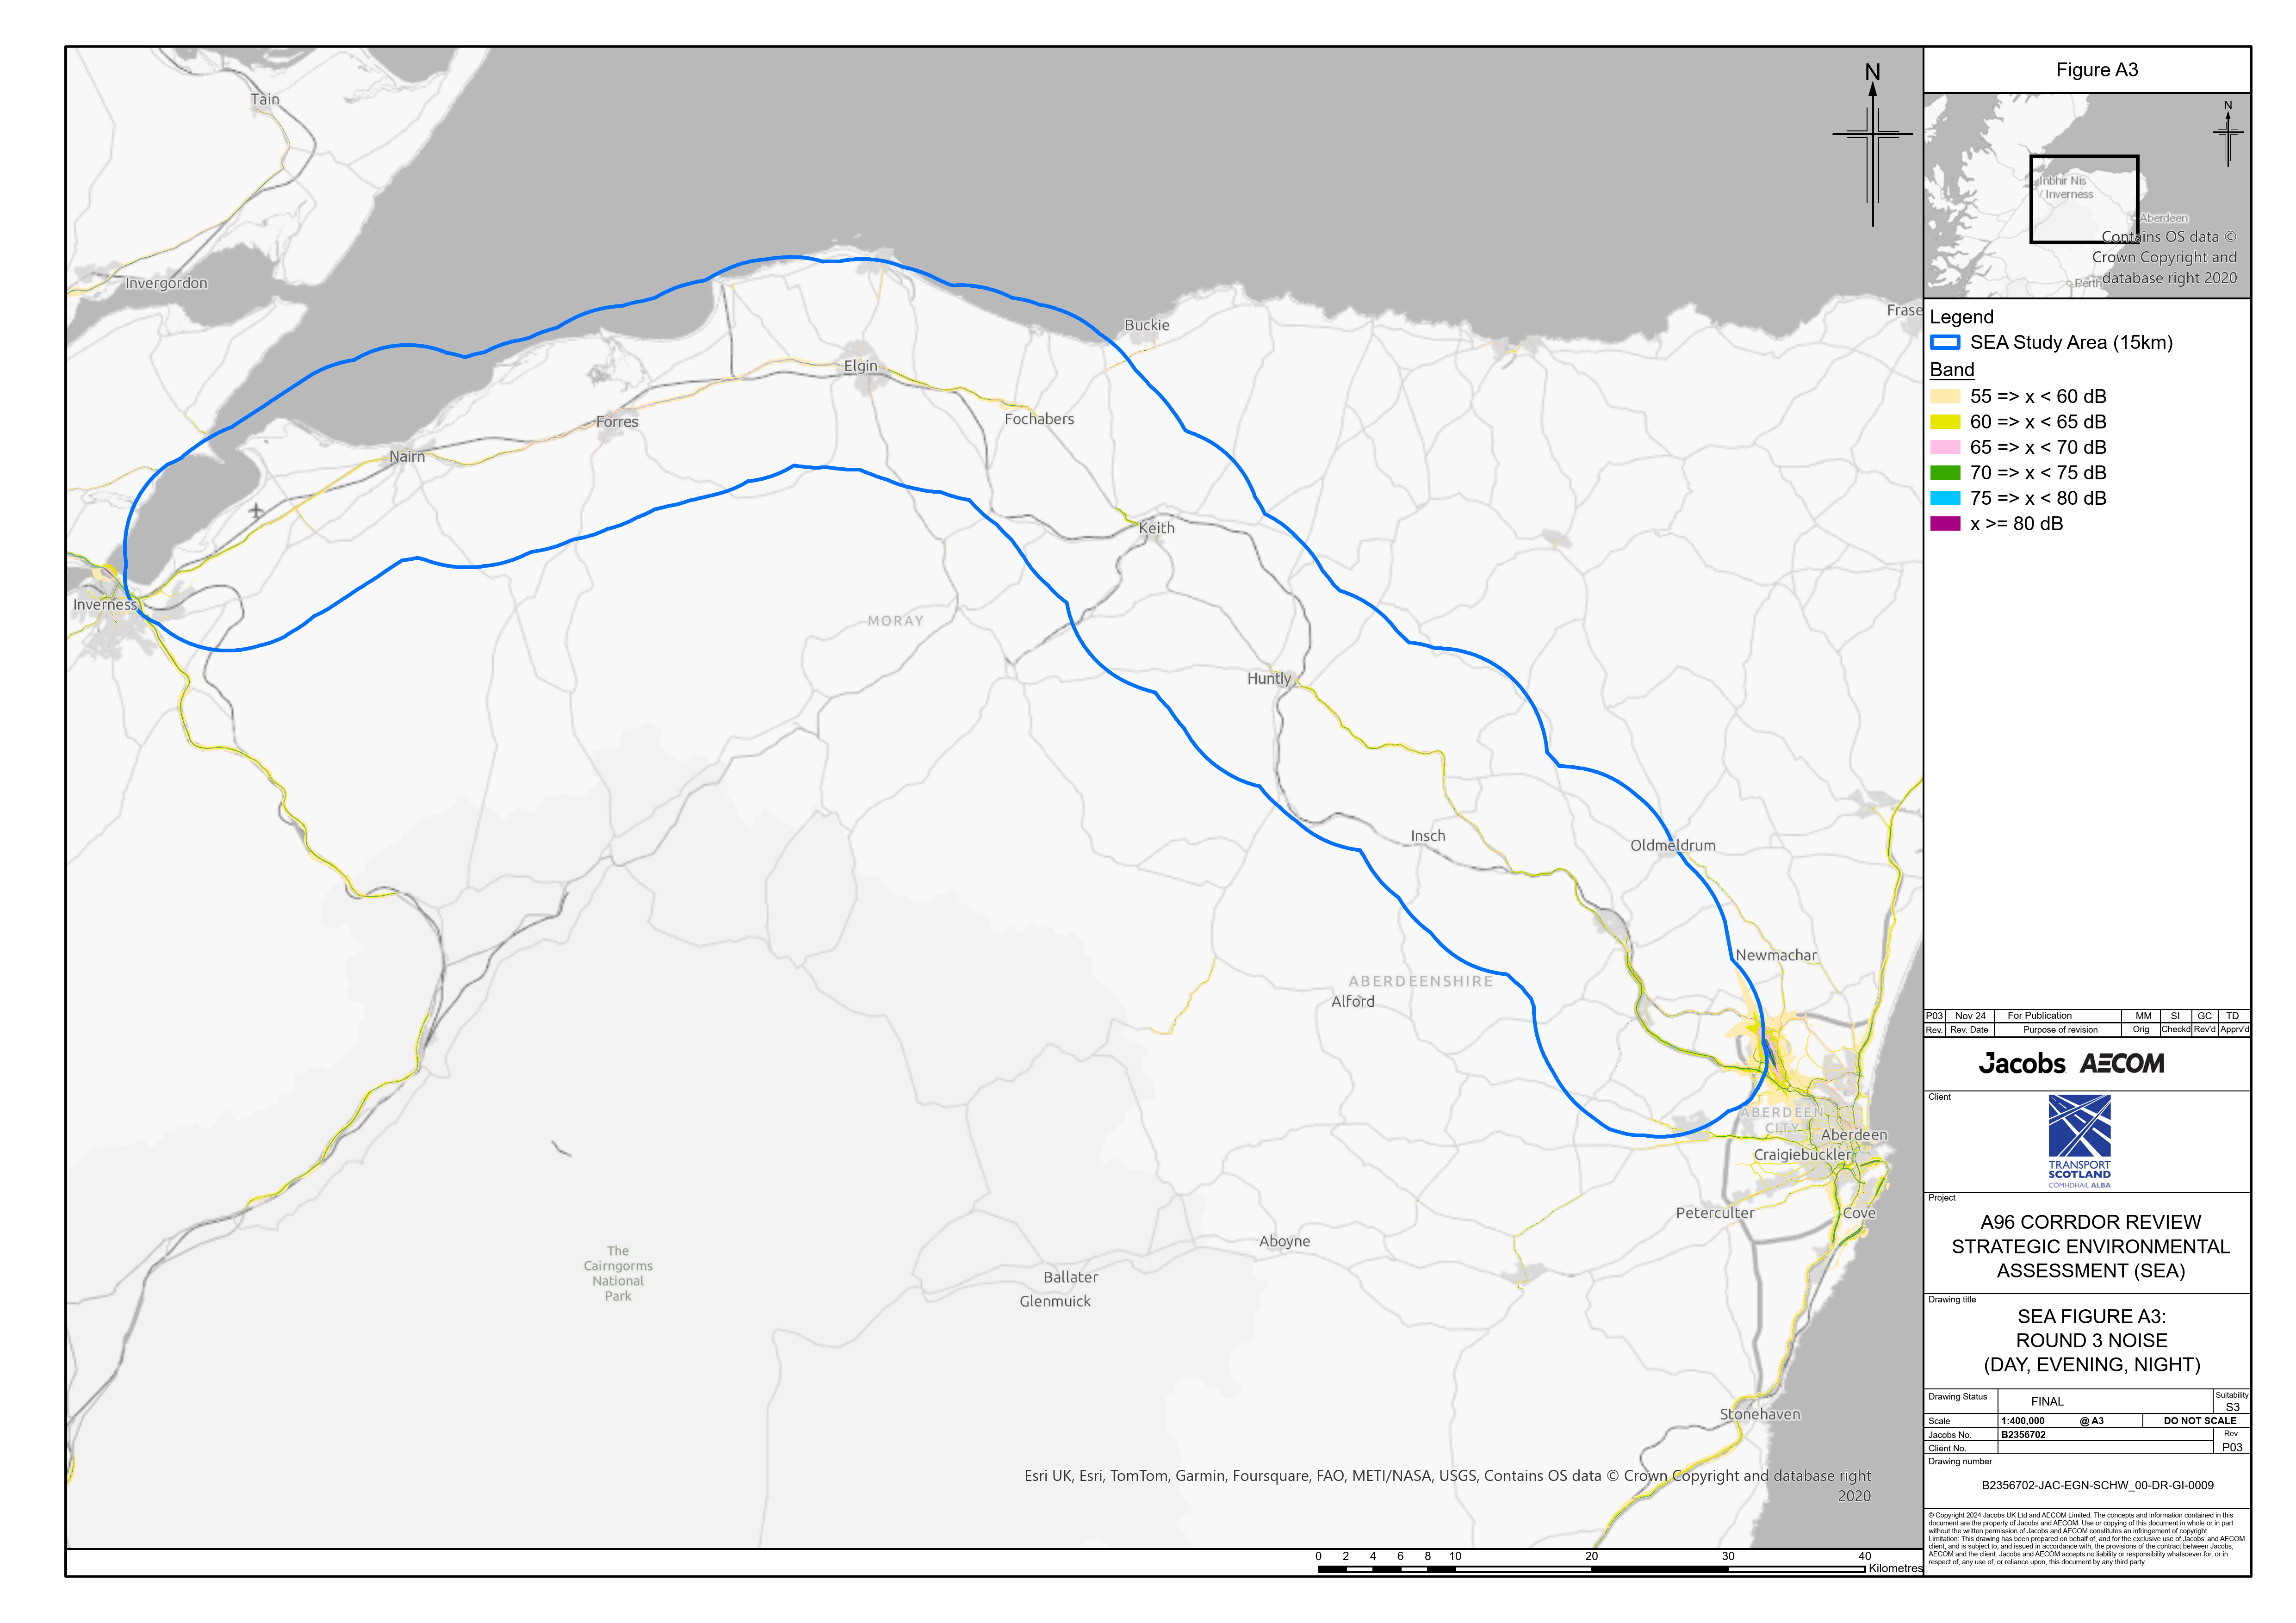
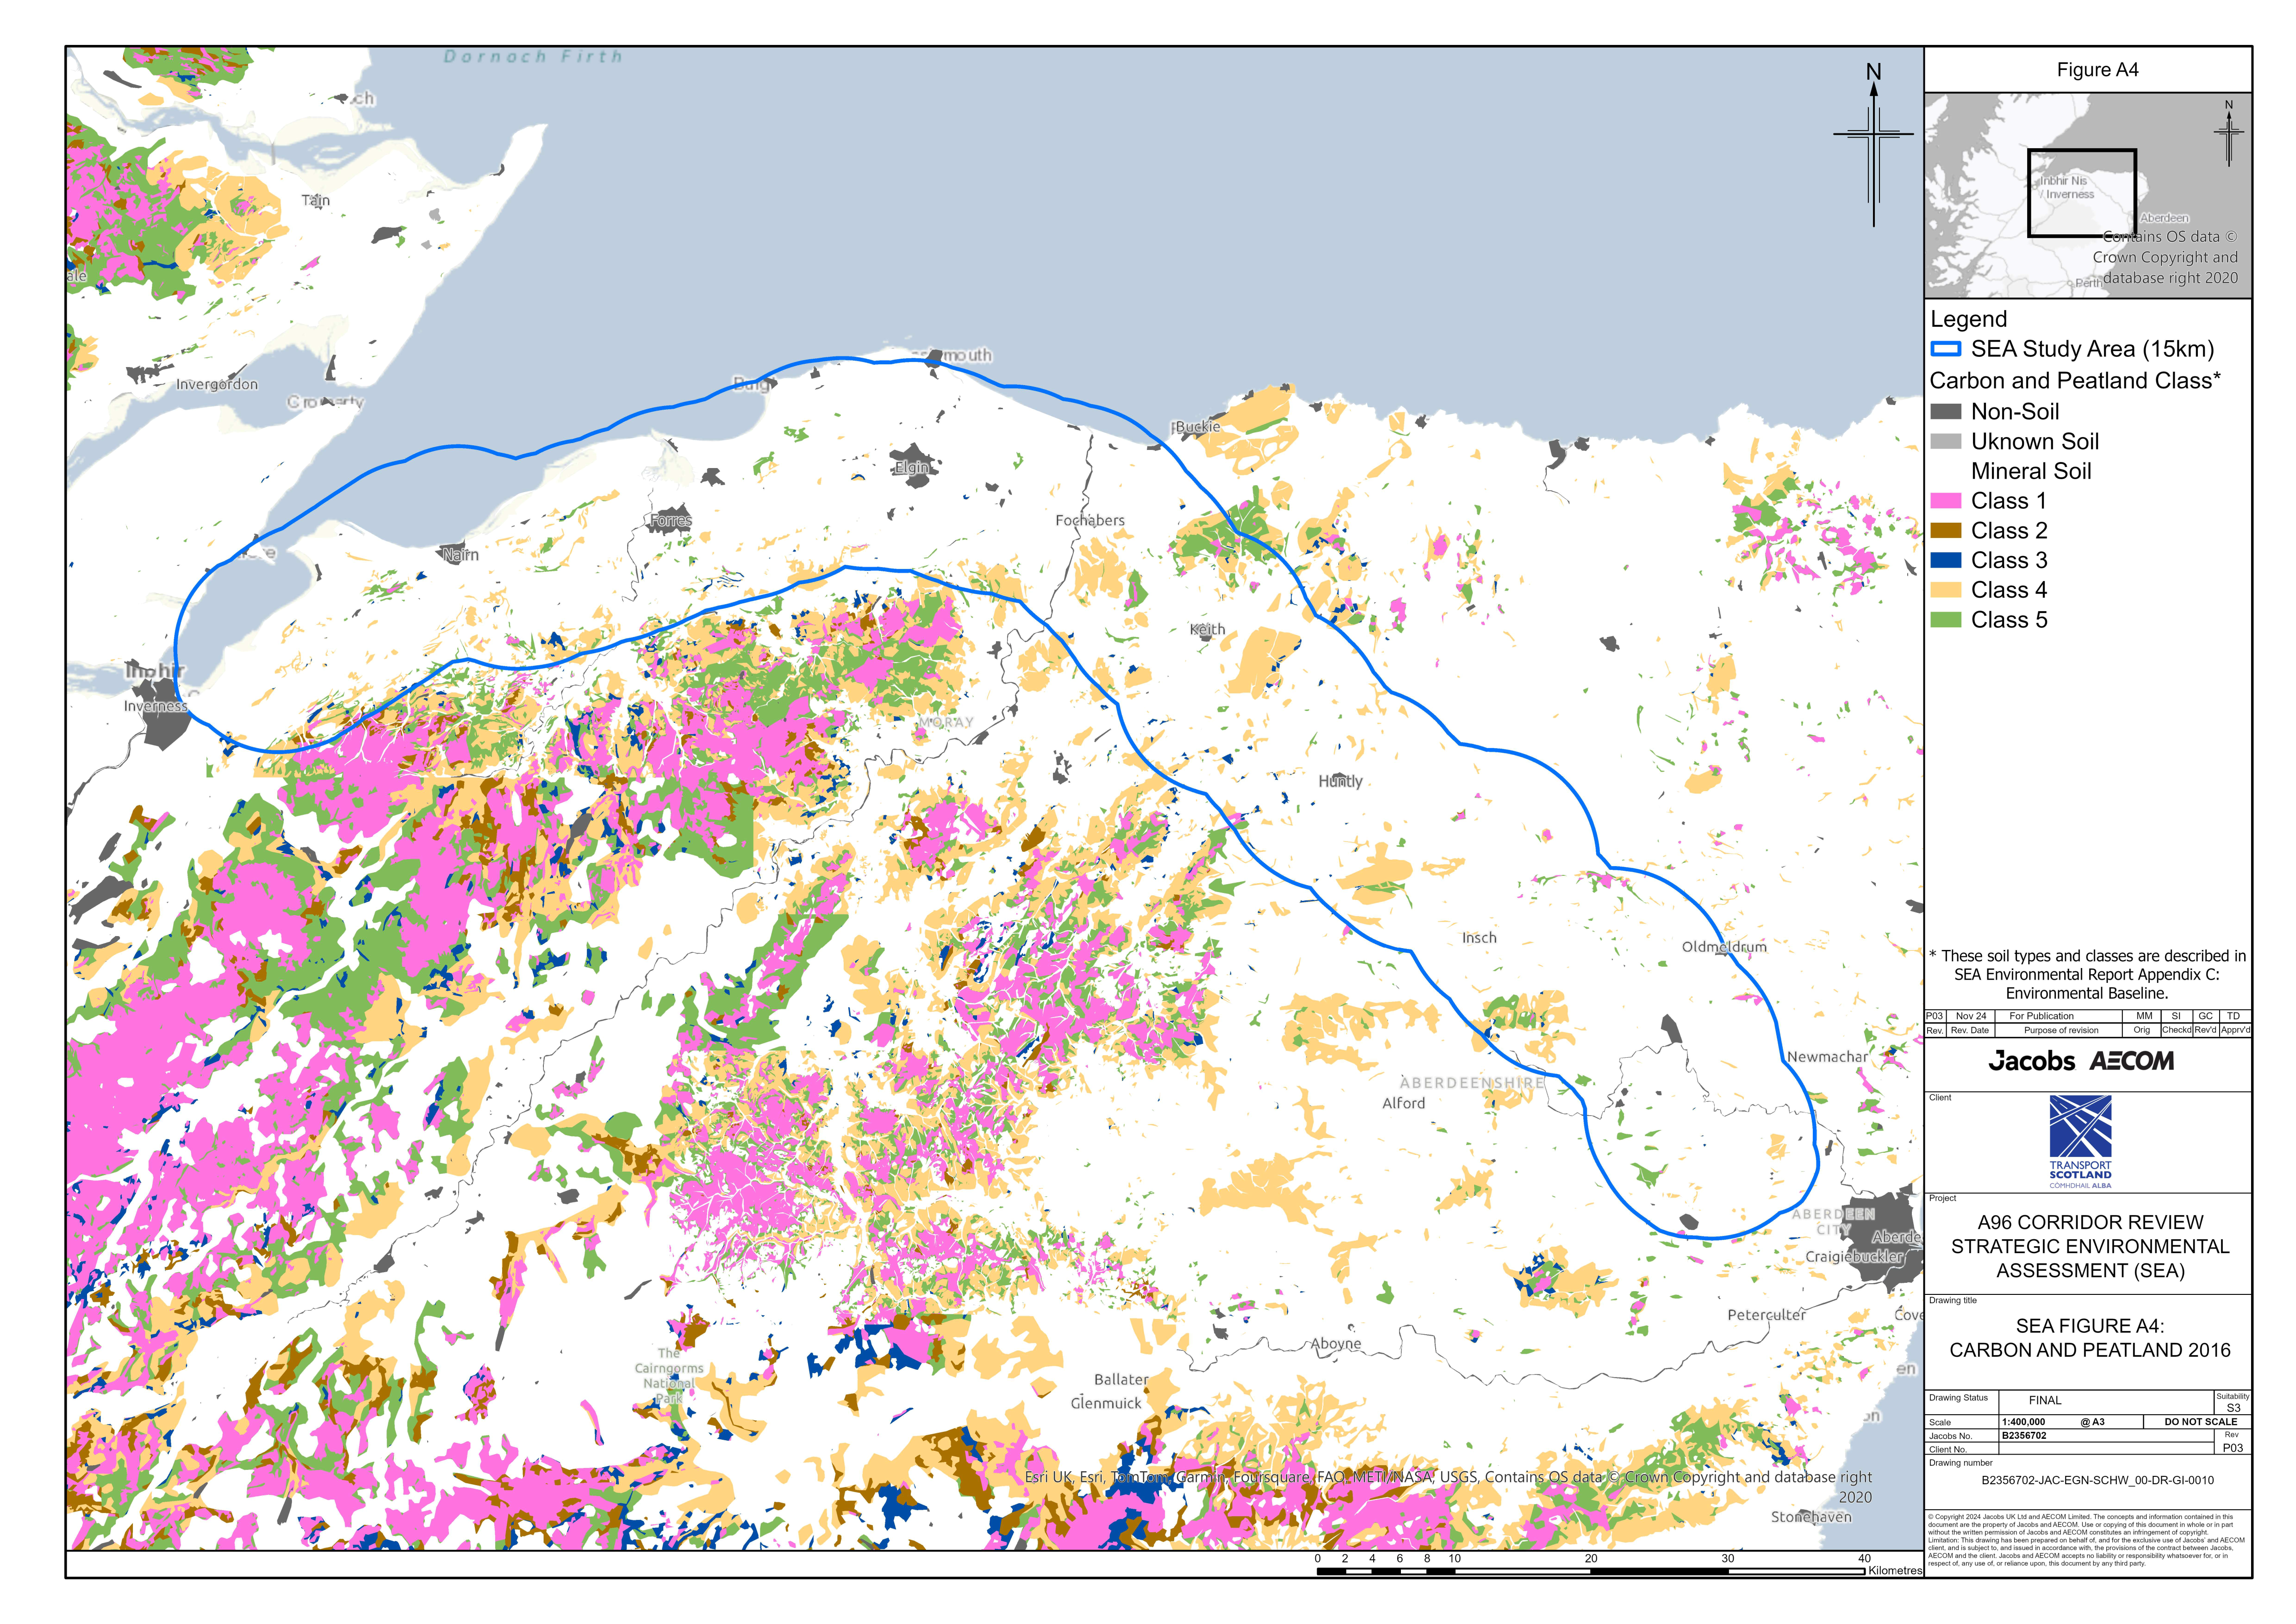
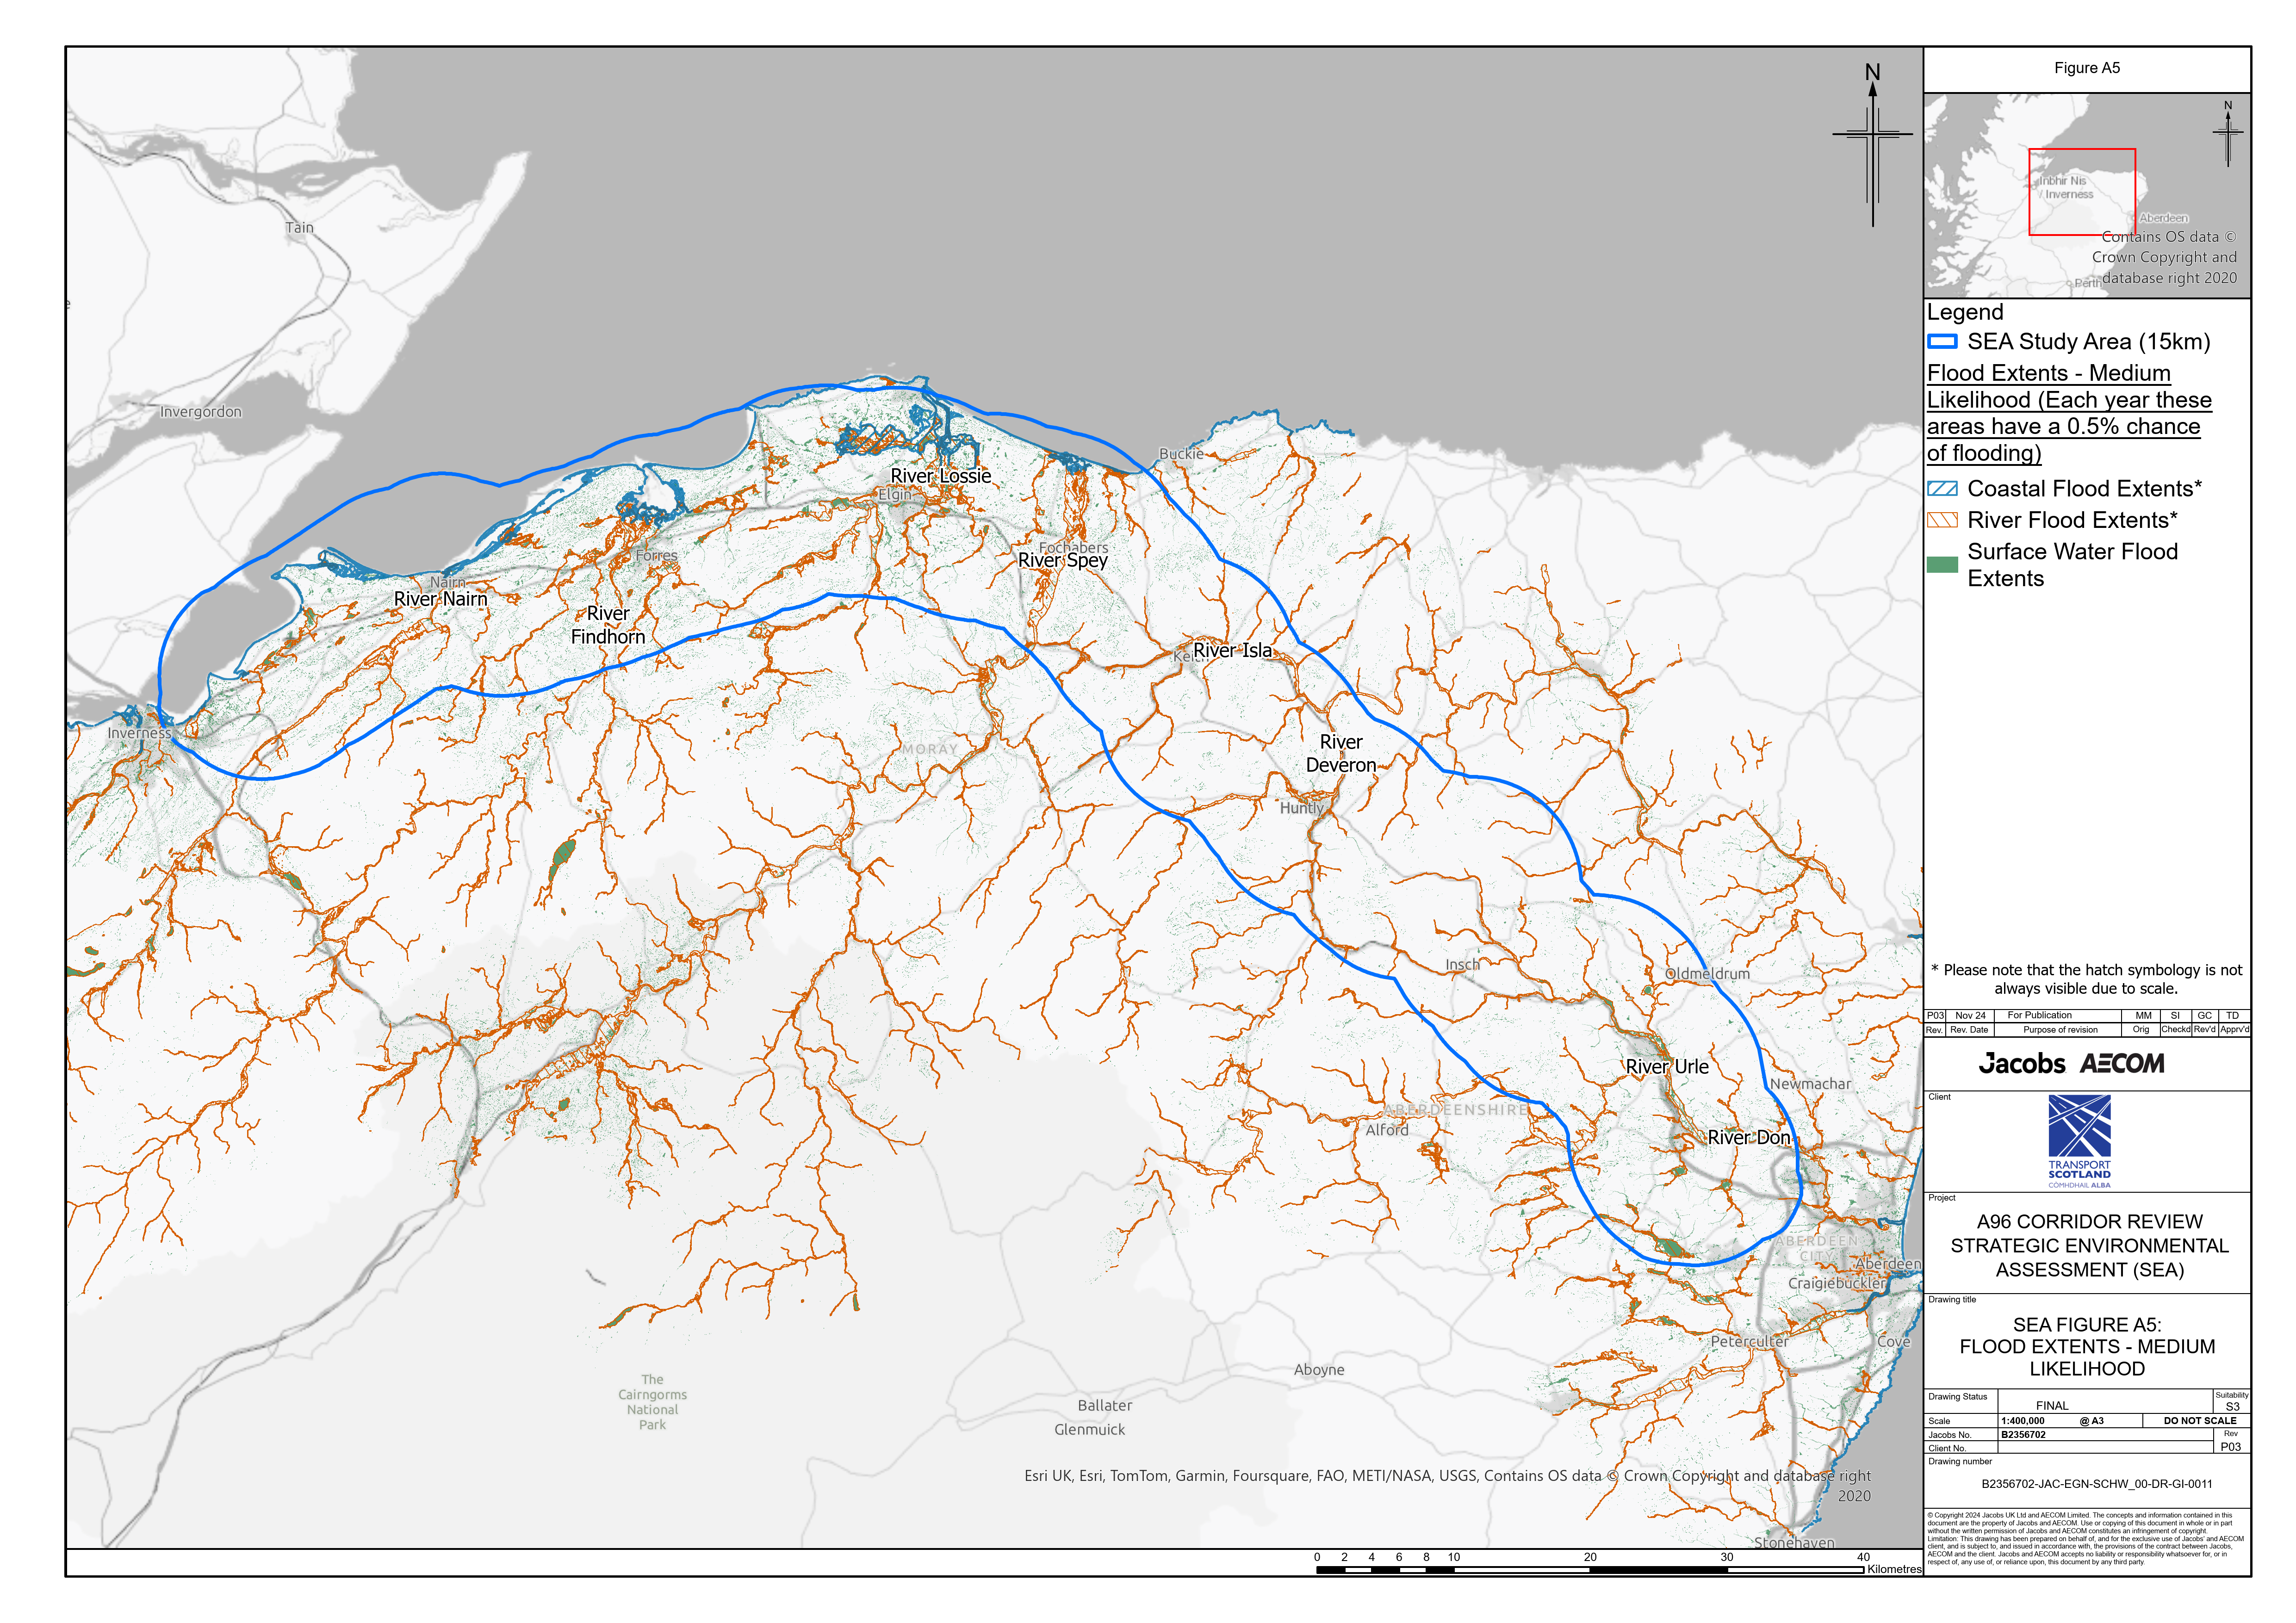
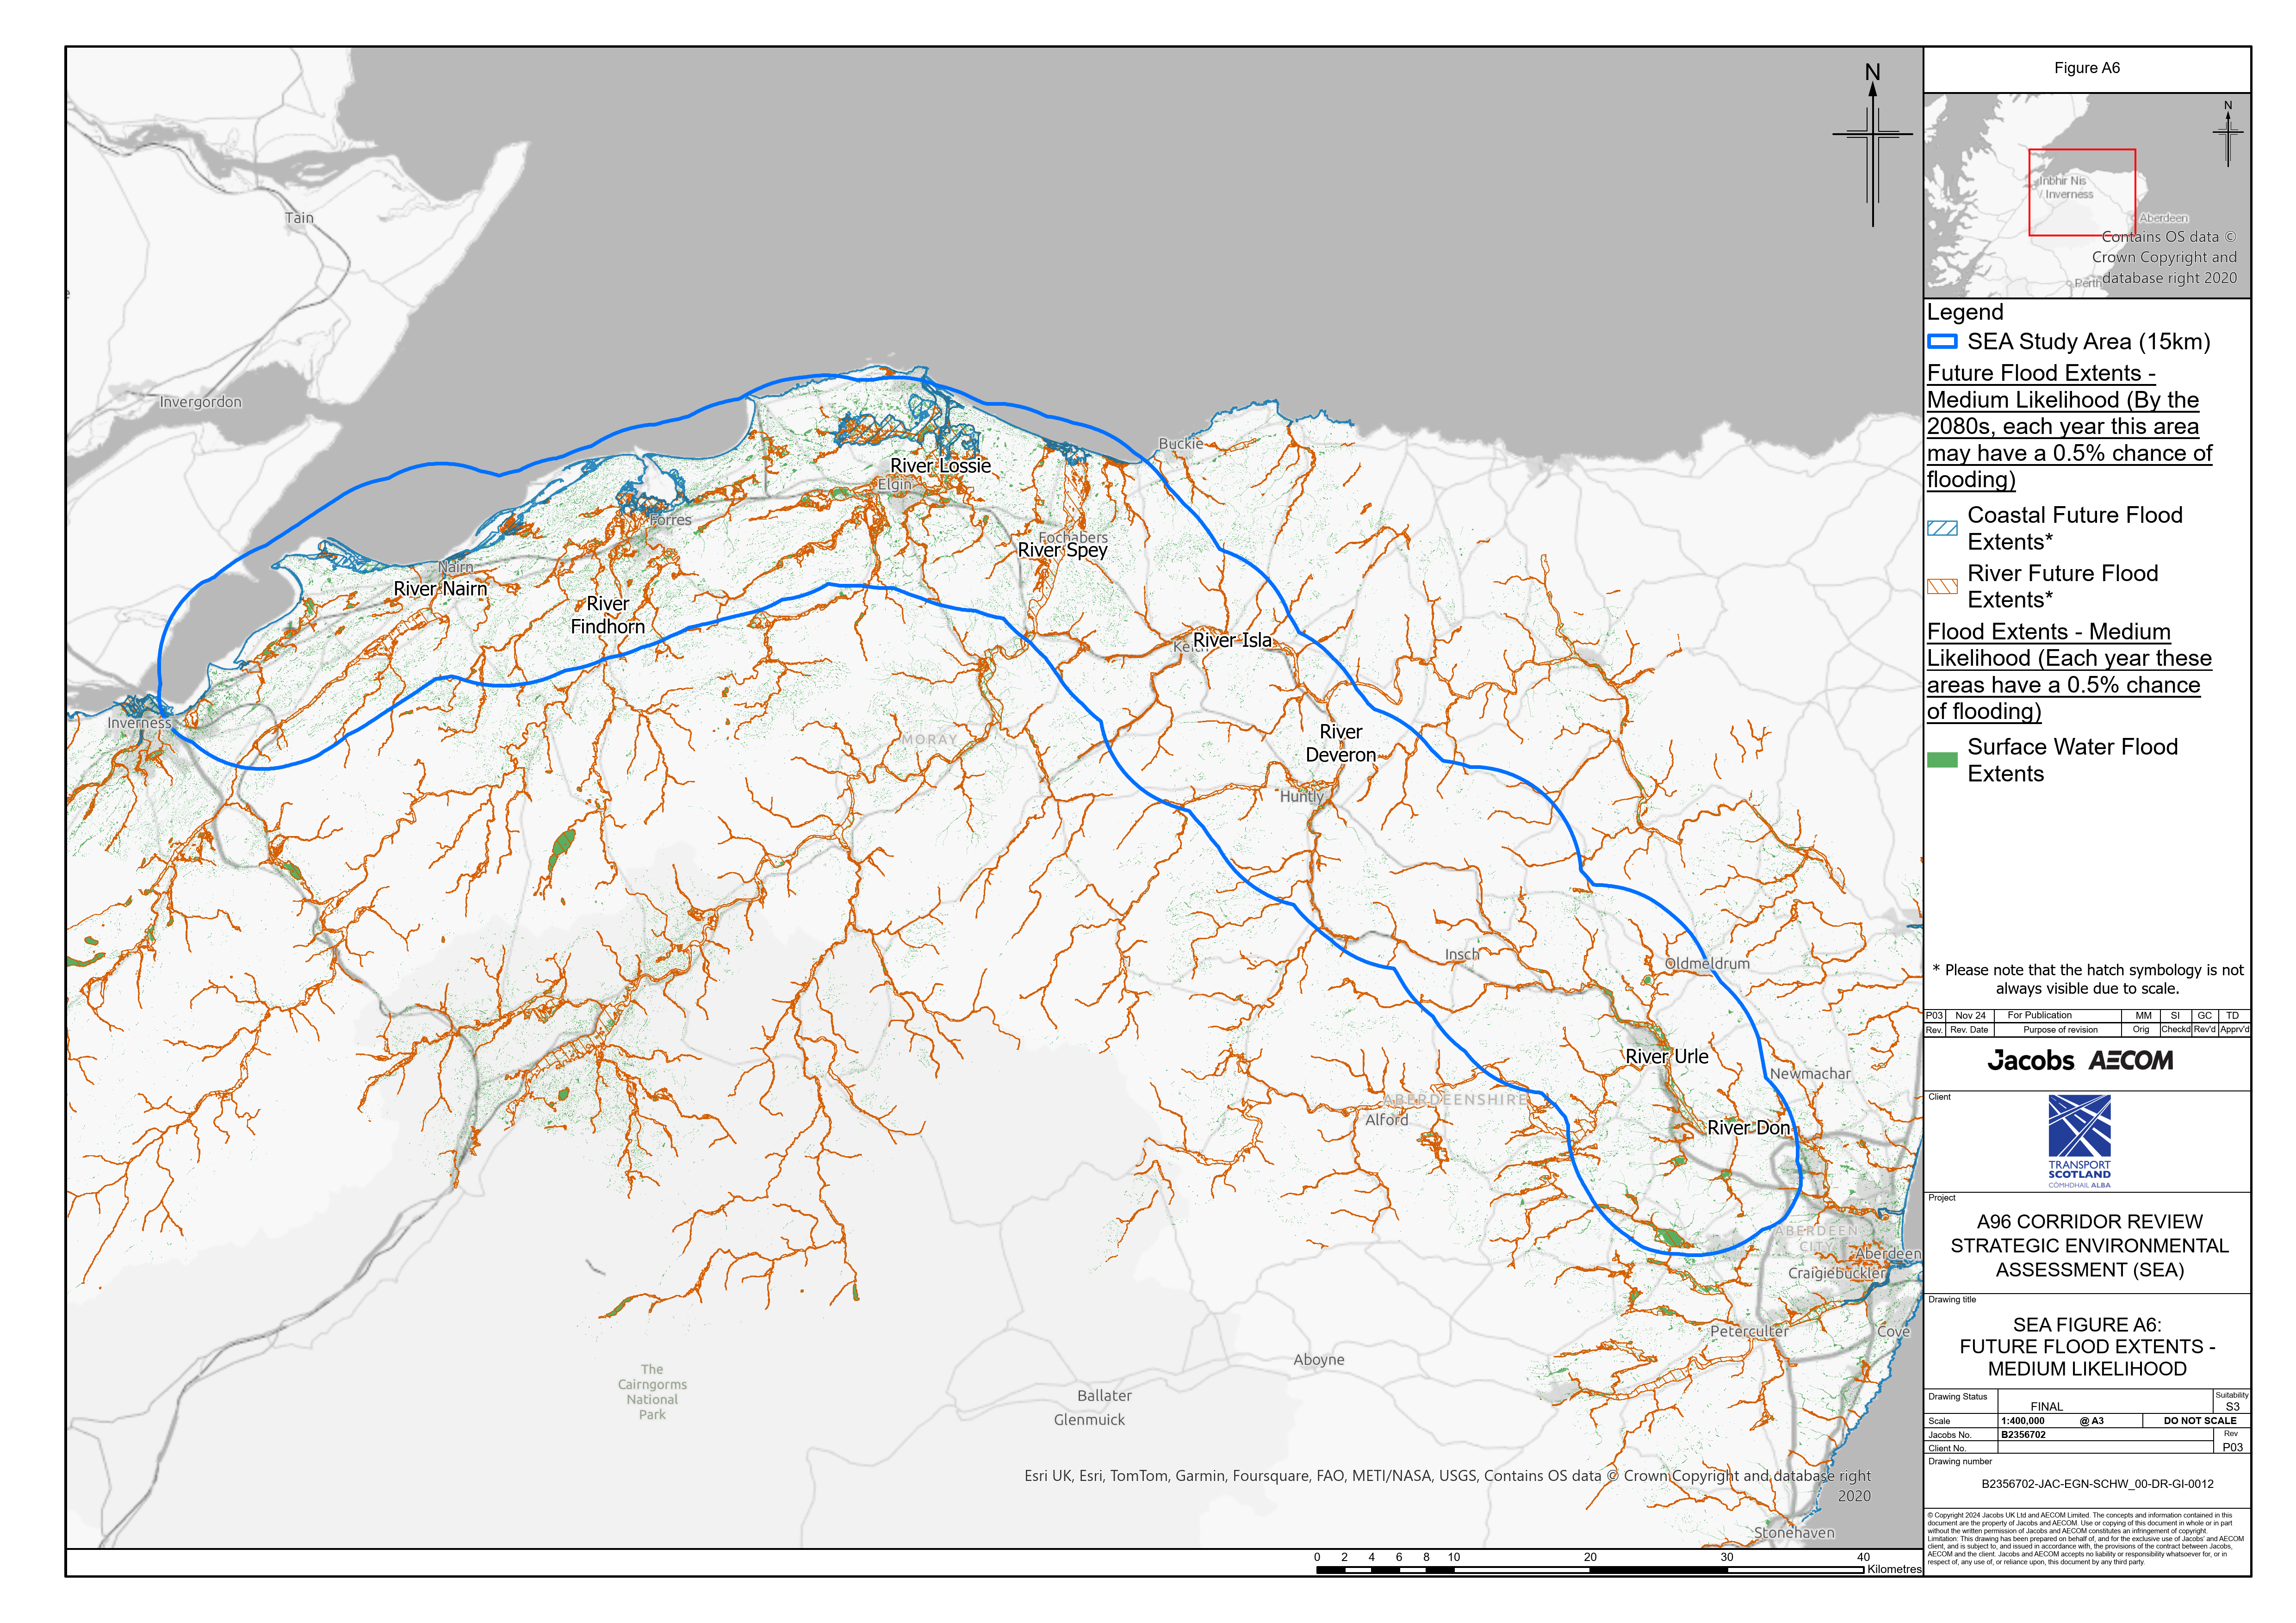
The following appendix figures visually display some of the environmental data collected as part of the SEA baseline data in relation to the 15km wide SEA study area. These should be viewed in conjunction with the baseline data contained in Draft Environmental Report Appendix C.

Figure showing a 15km wide corridor between Inverness and Aberdeen. This corridor represents the SEA study area. The figure also shows sites within and around this corridor that have been designated for their biodiversity, cultural heritage, geological and landscape importance. The figure shows the main settlements within and around the corridor. From west to east these include Inverness, Nairn, Forres, Burghead, Elgin, Keith, Huntly, Inverurie, Kintore and Aberdeen.
Figure A1: Environmental Designations
Figure showing a 15km wide corridor between Inverness and Aberdeen. This corridor represents the SEA study area. The figure also shows the principal categories of forestry within and around this corridor. These include Felling Permissions and licences, woodland creation sites, areas of native woodland and national forestry inventory sites. The figure shows the main settlements within and around the corridor. From west to east these include Inverness, Nairn, Forres, Burghead, Elgin, Keith, Huntly, Inverurie, Kintore and Aberdeen.
Figure A2: Forestry Overview
Figure showing a 15km wide corridor between Inverness and Aberdeen. This corridor represents the SEA study area. The figure also shows recorded noise levels within and around this corridor, ranging from 55 decibels to 80 decibels or above. The figure shows the main settlements within and around the corridor. From west to east these include Inverness, Nairn, Forres, Burghead, Elgin, Keith, Huntly, Inverurie, Kintore and Aberdeen.
Figure A3: Round 3 Noise (Day, Evening, Night)
Figure showing a 15km wide corridor between Inverness and Aberdeen. This corridor represents the SEA study area. The figure also shows a variety of soil classifications within and around this corridor. These classifications gives a value to indicate the likely presence of carbon-rich soils, deep peat and priority peatland habitat. The figure shows the main settlements within and around the corridor. From west to east these include Inverness, Nairn, Forres, Burghead, Elgin, Keith, Huntly, Inverurie, Kintore and Aberdeen.
Figure A4: Carbon and Peatland
Figure showing a 15km wide corridor between Inverness and Aberdeen. This corridor represents the SEA study area. The figure also shows Medium Likelihood Flood Extents within and around this corridor. Medium likelihood means that each year these areas have a 5% chance of flooding. This includes coastal, river and surface water flood risk. The main rivers within the study area are also shown. These are the River Lossie, River Spey, River Isla, River Deveron, River Urie and River Don. The figure shows the main settlements within and around the corridor. From west to east these include Inverness, Nairn, Forres, Burghead, Elgin, Keith, Huntly, Inverurie, Kintore and Aberdeen.
Figure A5: Flood Extents: Medium Likelihood
Figure showing a 15km wide corridor between Inverness and Aberdeen. This corridor represents the SEA study area. The figure also shows future projections (by the 2080s) of Medium Likelihood Flood Extents within and around this corridor. Medium likelihood means that each year these areas have a 5% chance of flooding. This includes coastal, river and surface water flood risk. The main rivers within the study area are also shown. These are the River Lossie, River Spey, River Isla, River Deveron, River Urie and River Don. The figure shows the main settlements within and around the corridor. From west to east these include Inverness, Nairn, Forres, Burghead, Elgin, Keith, Huntly, Inverurie, Kintore and Aberdeen.
Figure A6: Flood Extents: Medium Likelihood