Motor vehicles, traffic and driving
Motor vehicles, traffic and driving
Car and van access
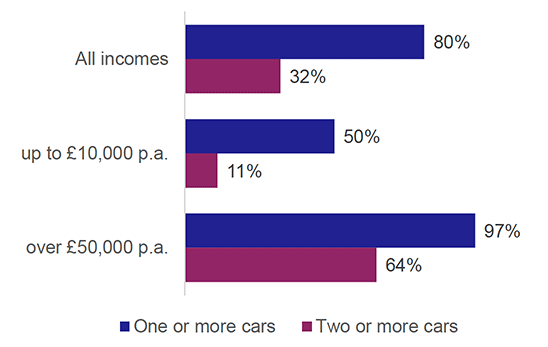
80% of households had access to one or more cars or vans for private use. 32% of households had access to two or more. [Table 18b, Table SUM1]
Car access increases with household income, as does the number of cars available per household: 50% of households with an annual income up to £10,000 had access to one or more cars, compared to 97% of households with an annual income of more than £50,000. [Table 18b and Figure 12]
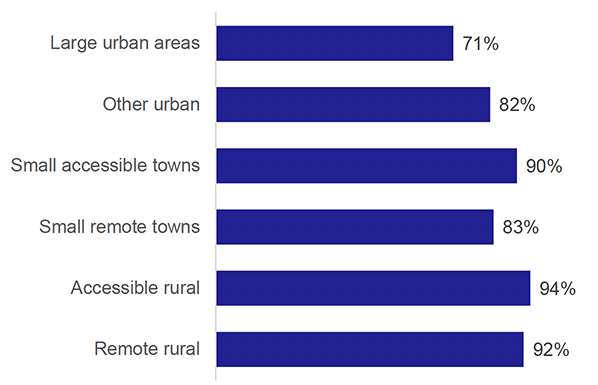
Households in rural areas were more likely to have access to a car than those in urban areas. Car access in accessible rural households was 94%, compared to 71% in large urban areas. [Table 18b and Figure 13]
Frequency of driving
70% of people drove at least once a week, while 34% drove every day. [Tables 20 & SUM1]
Frequency of driving was higher in rural areas than in urban areas, and increased with income. [Table 20]
Fuel spend and cost of parking
The average (mean) amount which an adult driver spent on vehicle fuel in the last month was £94. [Table 2a]
The average (mean) spent by an adult on parking (including non-drivers) was £0.80 per week. For those who drove, the figure was £1.10. [Table 52]
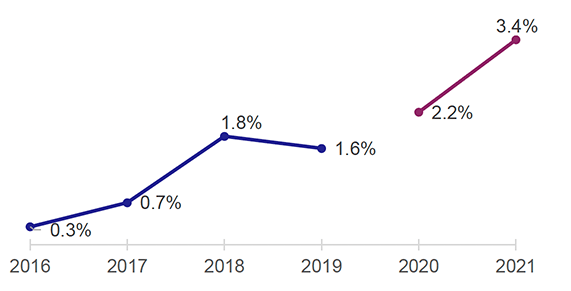
Electric vehicles
3.4% of people owned an electric car or van in 2021. [Table 49 and Figure 14]