Personal Travel
Personal Travel
Over the period that telephone surveys were being conducted (April 2021 to March 2022) people in Scotland were subject to some restrictions on travel and daily activity due to coronavirus measures.
Who travels?
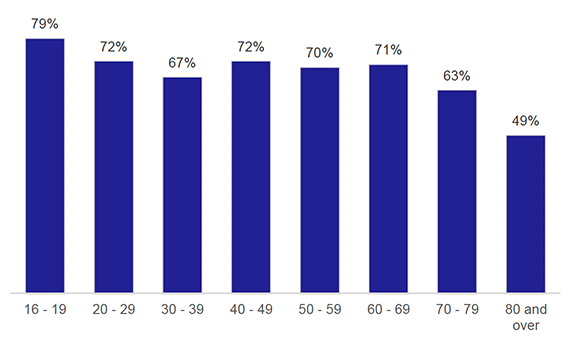
69% of people had travelled the day before their survey interview. Fewer people travelled in the oldest age groups, with 49% of those over 80 travelling the previous day. [Table TD1 and Figure 1]
Disabled people (58%) were less likely to travel than those who were not disabled (73%). [Table TD1]
How do people travel?
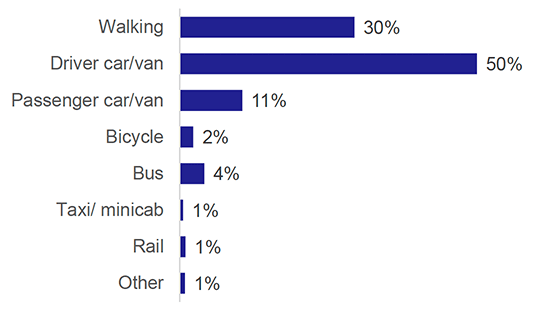
50% of journeys were made by driving a car or van. Walking was the next most popular mode of transport (30% of journeys). 11% of journeys were as car or van passenger, 4% by bus and 1% by rail. [Table TD2, Table SUM1, and Figure 2]
Why do people travel?
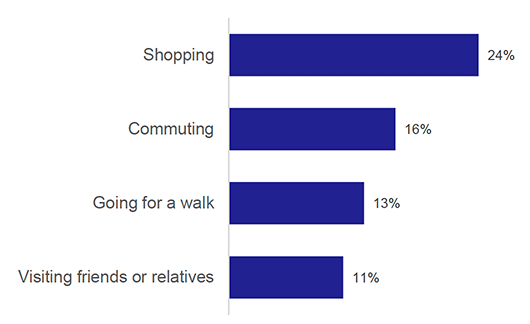
Shopping was the most frequent reason for travel (24% of journeys). Commuting was the next most common at 16%. 13% of journeys were to go for a walk. [Table TD3 and Figure 3].
Travel to Work
Over much of the period that telephone surveys were being conducted (April 2021 – March 2022) workers across Scotland were encouraged to work from home where practicable.
Working from home
40% of employed people reported that they currently worked from home. [Table 7a and Figure 4]

30% of those who earnt up to £20,000 worked from home, compared to 46% of those with incomes above £50,000. [Table 7a]
When asked specifically how many days a week they travelled to work, 34% said none, while 35% travelled 5 or more days. [Table 56 and Figure 5]

How do people travel to work?
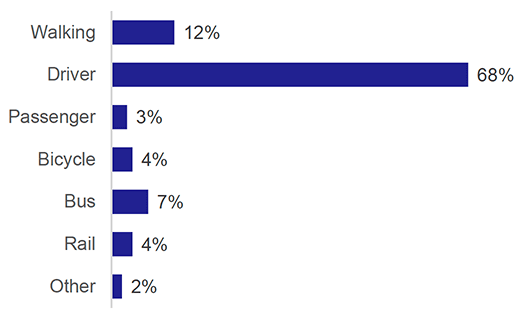
Amongst those who made a journey to work, 71% of people usually travelled by car or van, usually as a driver (68%). 12% of people usually walked to work, while 7% usually took the bus. [Table 7 and Figure 6]
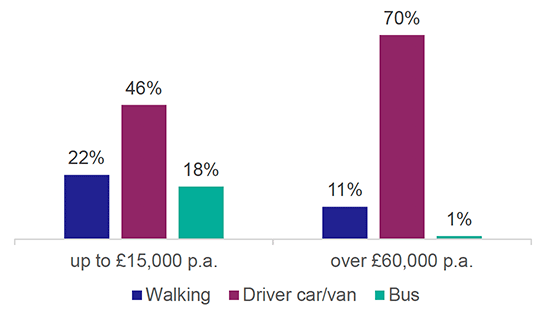
Who travels to work by which mode?
Those on an income below £15,000 were less likely to travel by car (46%), and more likely to walk (22%) or get the bus (18%) than those on higher incomes. [Table 7 and Figure 7]
Travel to School
How do children travel?
Over half of children (54%) walked to school, over a fifth (22%) travelled by car and around a fifth (19%) used a bus. [SUM1 and Table 15]
There was variation in mode of travel by age. In the 4 to 11 age group, 65% reported walking to school, compared to 42% in the 12 to 18 age group. The older age group were more likely to catch a bus than younger children (36% compared to 6%). [Table 15 and Figure 8]

How long do people travel for?
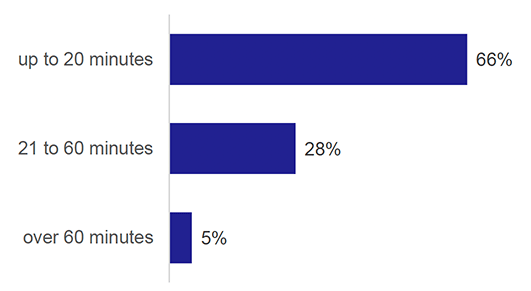
Duration of travel
The majority of journeys reported were of short duration. 66% of journeys lasted up to 20 minutes. Only 5% lasted more than an hour. [Table TD6 and Figure 9]
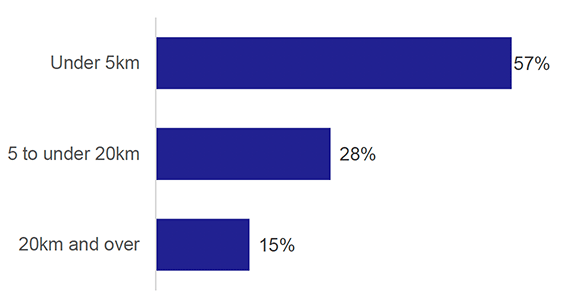
Distance travelled
57% were under 5 km. [Table TD4a and Figure 10]
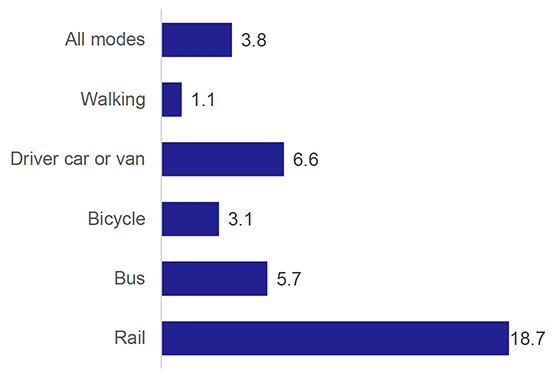
The median journey length was 3.8 km, and the mean journey length was 11.4km. [Table TD5]
Walking journeys were an average (median) length of 1.1 km, with car driver journeys at 6.6 km. [Table TD 5a and Figure 11]
73% of journeys under 1 km were made on foot; car journeys (whether as a driver or passenger) accounted for most of the remainder (20%). Car was the most common mode of travel for all distance groupings greater than 2 km. [Table TD2a]