Motor vehicles, traffic and driving
Driving licences
In 2023, 71% of people aged 17 and over held a full driving licence. Men were more likely to hold a driving licence than women, with 77% of men aged 17+ having one, compared to 67 per cent of women. The percentage of men holding a licence has been fairly stable since 1999, but for women this has been steadily increasing from 51% in 1999. [Table 1]
People were more likely to have driving licences in rural areas (62% of adults in large urban areas had a driving licence, compared to 86% of those in rural areas). [Table 1]
Car and van access
74% of households had access to one or more cars or vans for private use. This has increased since 2013 (70%). 29% of households had access to two or more cars or vans for private use. This has also increased since 2013 (26%) [Table 18b, Table SUM1]
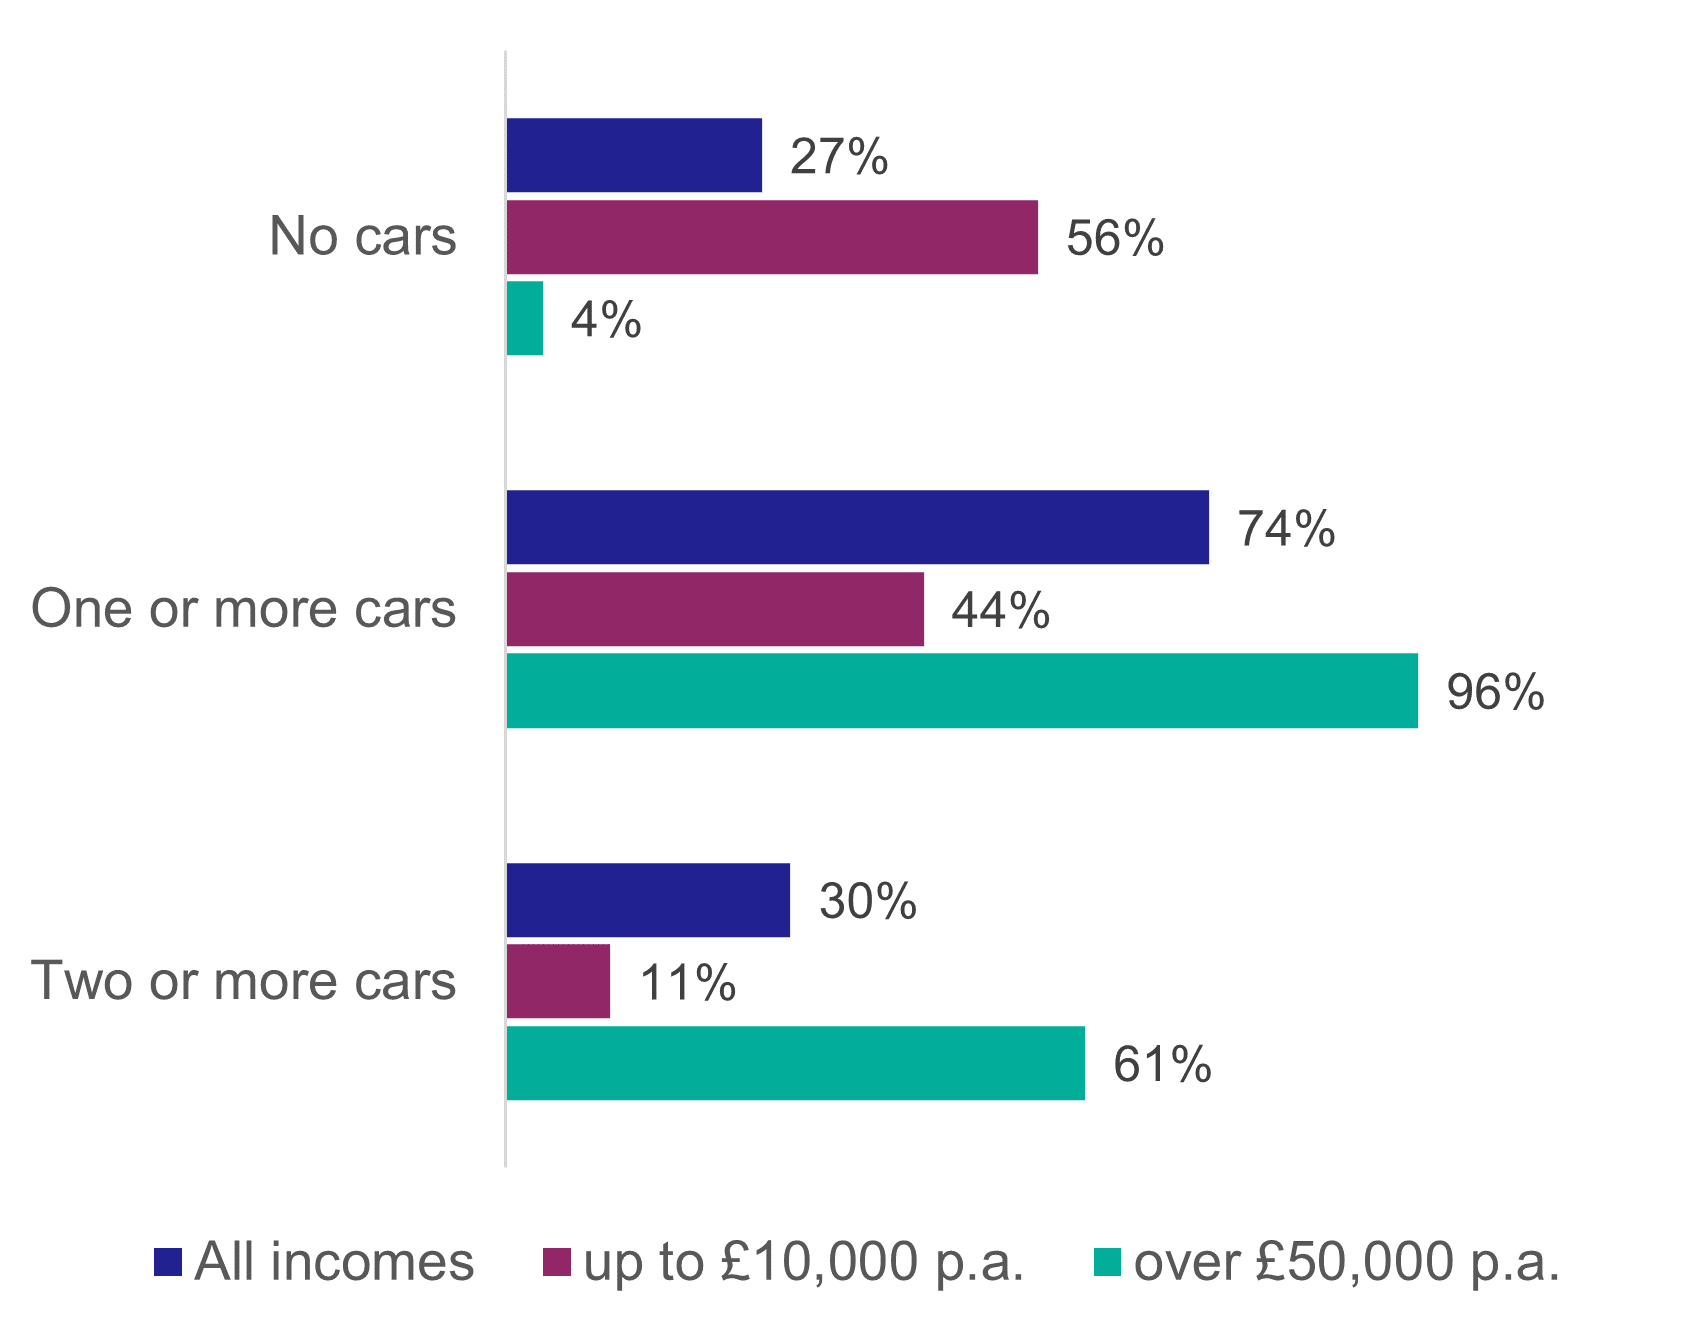
Car access increased with household income, as did the number of cars available per household: 44% of households with an annual income up to £10,000 had access to one or more cars, compared to 96% of households with an annual income of more than £50,000. [Table 18b and Figure 13]
Households in rural areas were more likely to have access to a car than those in urban areas. Car access in accessible rural households was 88%, compared to 64% in large urban areas, where more public transport is available. [Table 18b]
Frequency of driving
65% of people drove at least once a week in 2023 with 35% driving every day. The percentage driving every day remains lower than in 2019 (43%). [Tables 20 & SUM1]
Frequency of driving was higher in rural areas than in urban areas, and increased with income. [Table 20]
Fuel spend and cost of parking
The average (mean) amount which an adult driver spent on vehicle fuel ‘in the last month’ was £127. [Table 2a]
The average (mean) spent by an adult on parking (including non-drivers) was £0.80 per week. For those who drove, the figure was £1.20. [Table 52]
Electric vehicles
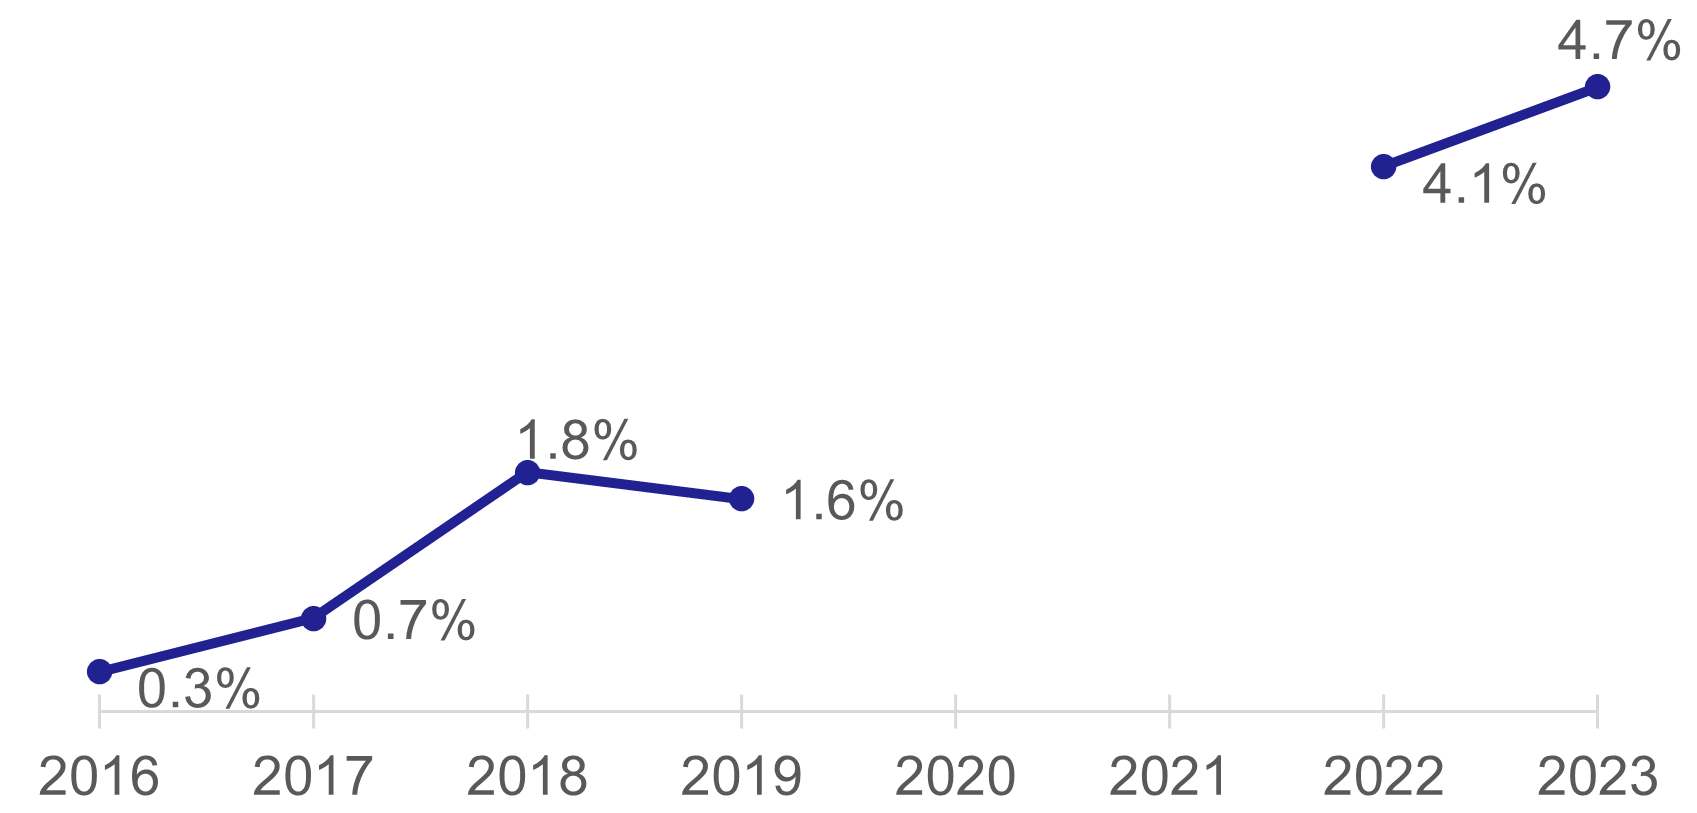
4.7% of driving licence holders reported owning an electric car or van in 2023. This is up from 0.3% in 2016. [Table 49 and Figure 14]
Electric cars being environmentally friendly was the most common reason respondents gave for having bought, or why they would consider buying, a plug-in electric car or van (69% of respondents) [Table 50].
The percentage of drivers saying they wouldn’t consider buying an electric car increased to 54% in 2023 from 42% in 2022. [Table 49]
When asked their reasons for not considering buying a plug-in electric car or van the most common answer given was the cost of vehicle purchase (52%), followed by availability or convenience of charging points (48%) and the battery (i.e. the distance that can be travelled on a charge) (42%) [Table 51].