Personal Travel
How much are people travelling?
In 2023, 64% of people had travelled the day before their survey interview. This is slightly higher than in 2022 (61%), but well below the 2019 figure of 74%. This suggests there has been a sustained reduction in daily travel since the COVID-19 pandemic. [Table TD1].
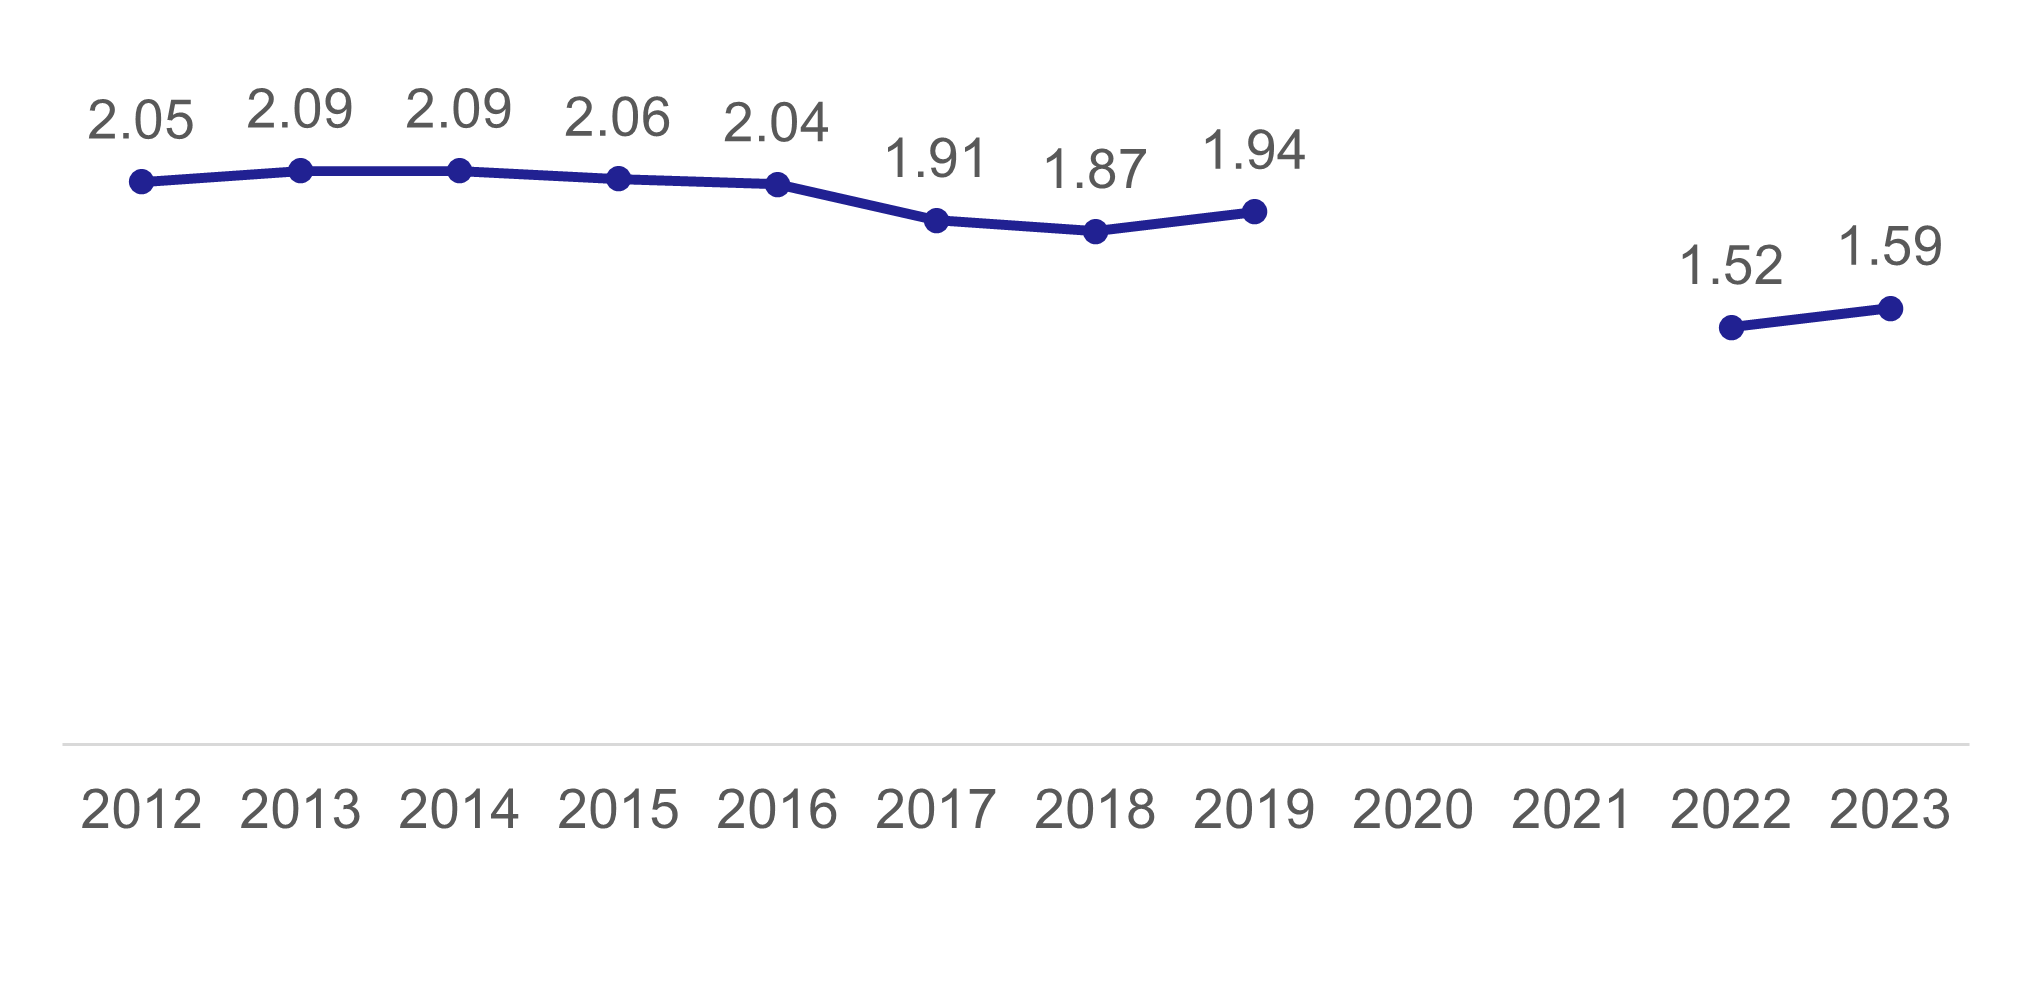
The average number of trips per adult the day before their survey interview was 1.59 in 2023. This is lower than the 2019 figure of 1.94. [Table TD2e, TD3a, Figure 1].
Who travels?
The reduction in travel since 2019 has been seen across the population, with decreases seen for males and females, all age groups, and all geographic sub-groups. [Table TD1]
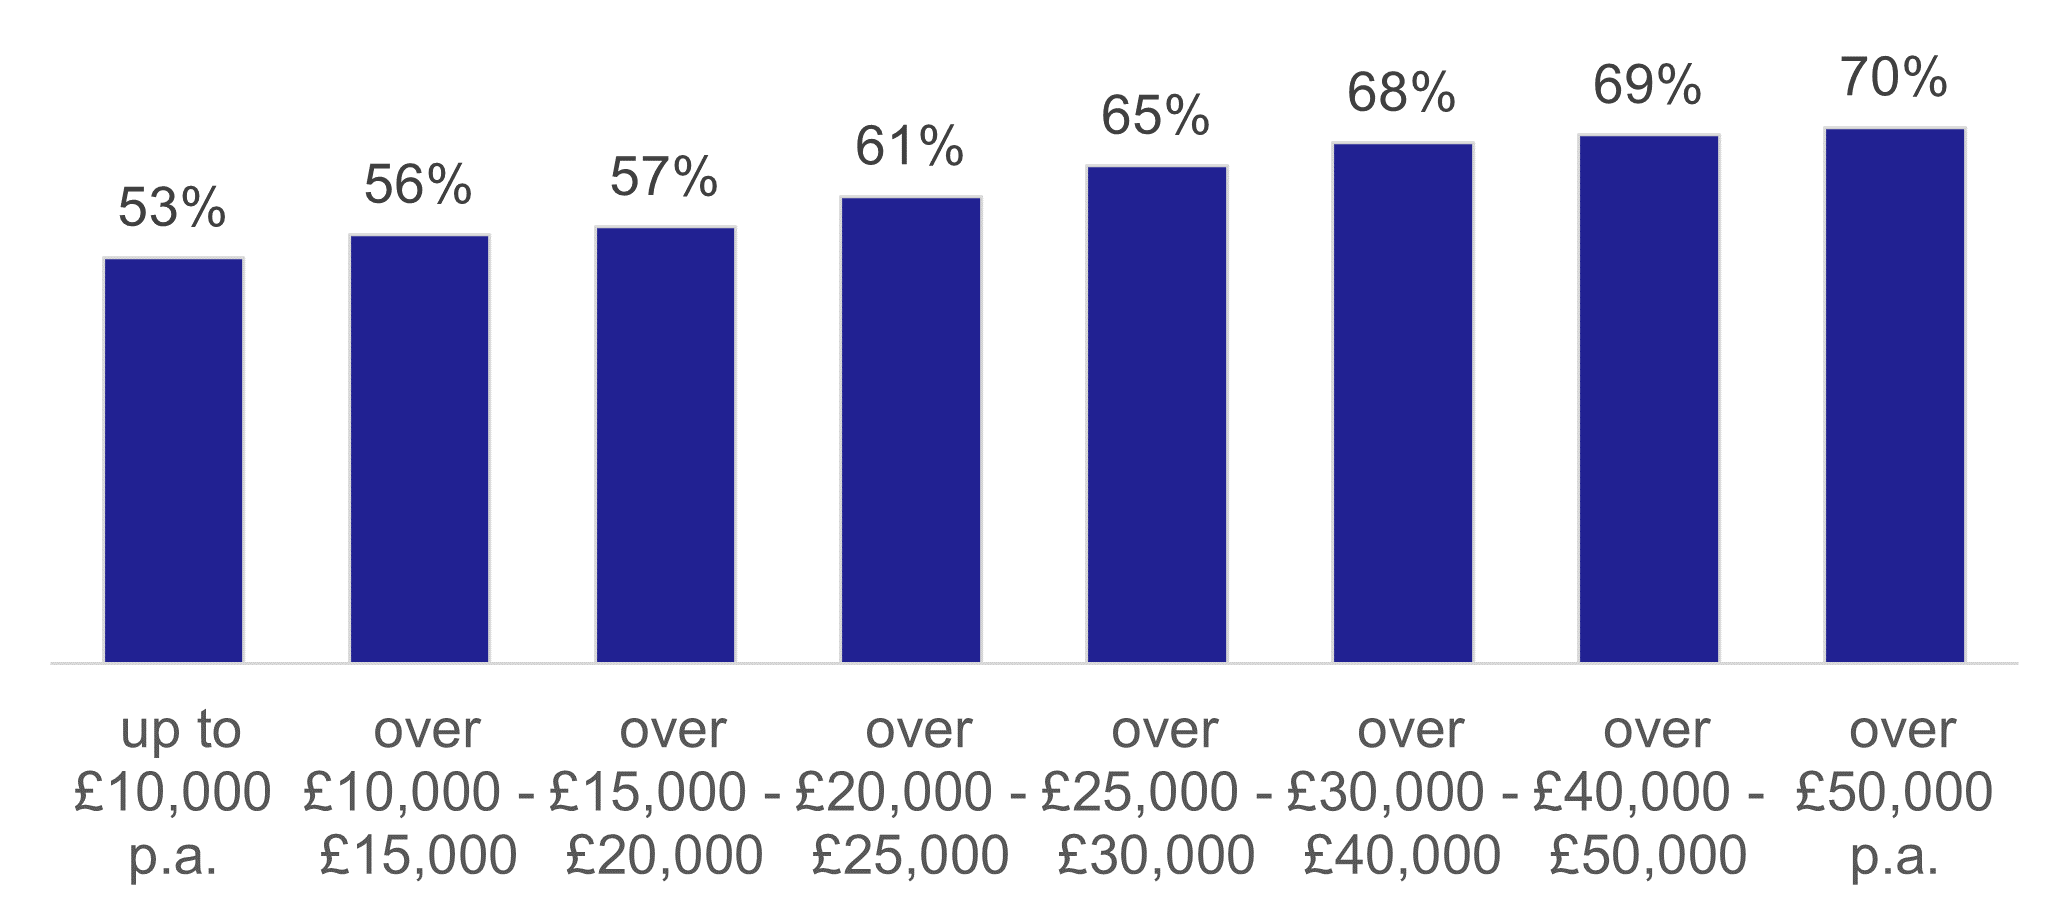
The percentage travelling increased with income, with 53% of those with a household income below £10,000 travelling compared to 70% of those with an income above £50,000. [Table TD1 and Figure 2]
How do people travel?
Driving a car or van was the most common mode of transport, accounting for over half of journeys (51%). This is a drop since 2022 (55%).
Walking was the next most common mode of transport and saw a rise from 23% of journeys in 2022 to 25% of journeys in 2023. 12% of journeys were as car or van passenger, 7% by bus and 2% by rail. [Table TD2, Table SUM1, and Figure 3]

The overall reduction in travel between 2019 and 2023 means that, although the proportion of journeys made by each mode is similar over time, the number of journeys in 2023 for most modes was lower than before the COVID-19 pandemic. The number of journeys made by walking and cycling were at similar levels to 2019 and prior years. [Table TD2e]
Why do people travel?
As has consistently been the case in recent years, the two most frequent reasons for travel were shopping (24% of journeys) and commuting (21% of journeys). The proportion of journeys made for commuting was slightly lower in 2023 than in 2019 (21% vs 23%). ‘Going for a walk’ has seen an increase to 10% of journeys from 7% in 2019. [Table TD3 and Figure 4].

The number of journeys made for most purposes was similar in 2023 to 2022, but commuting trips per adult per day remained down by a quarter since 2019 (0.45 to 0.34). [Table TD3a]
Travel to Work
Working from home
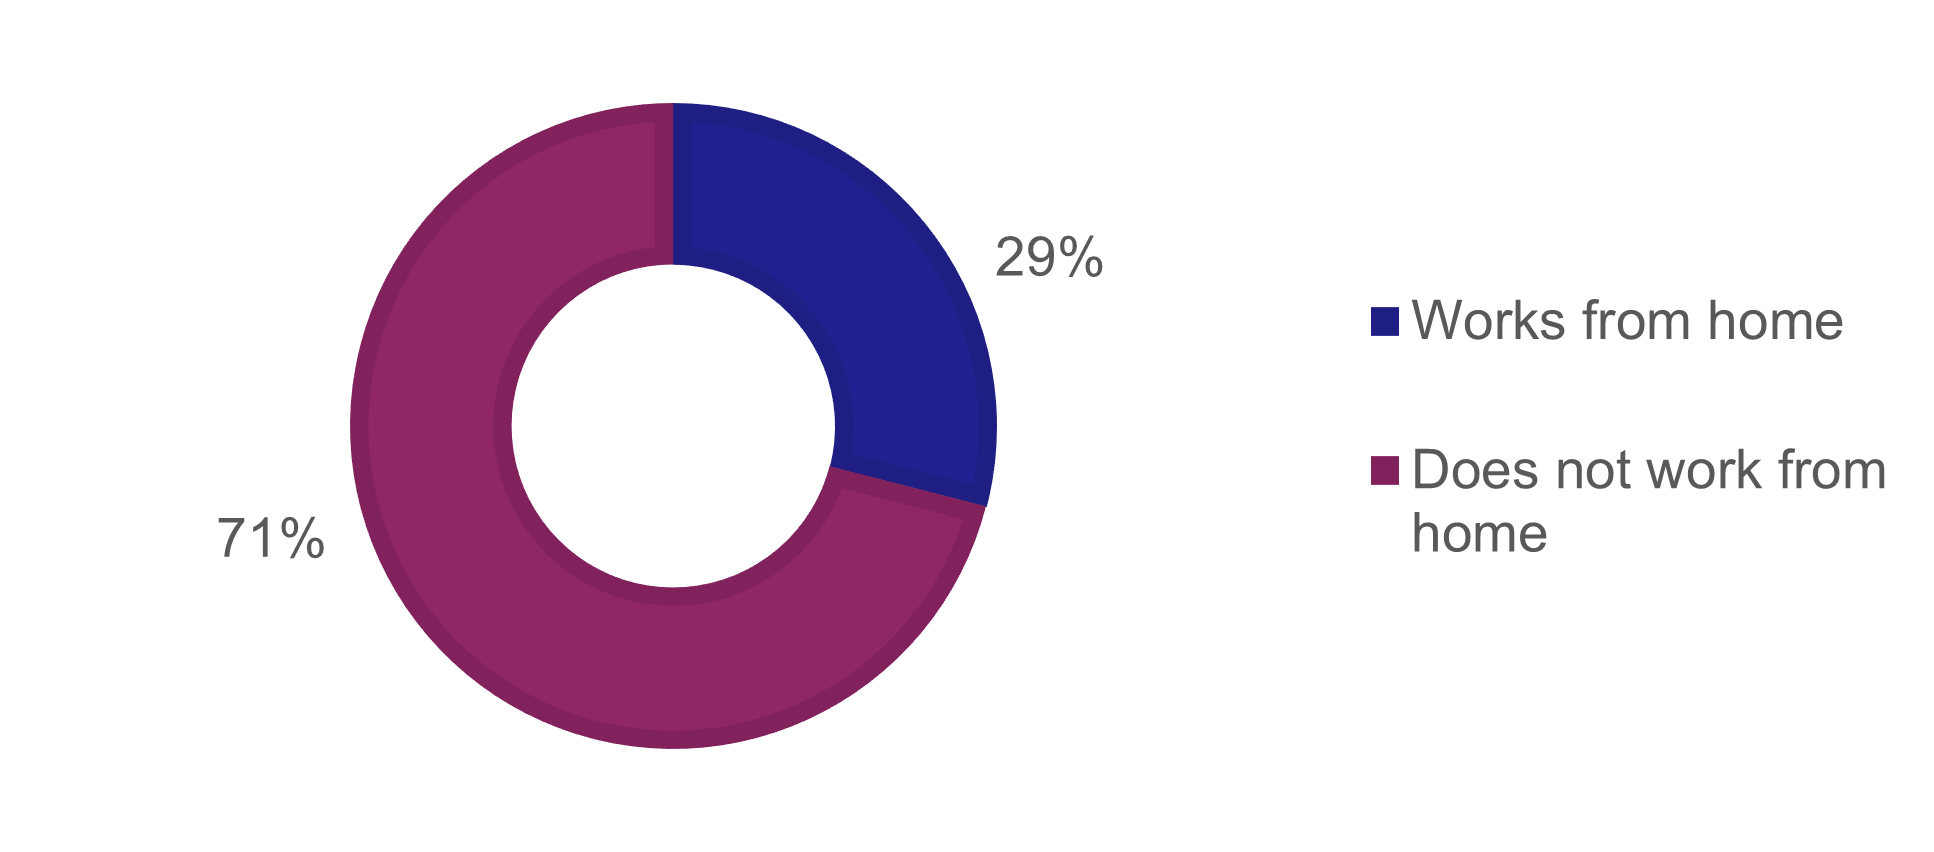
In 2023, the proportion of employed people who described themselves as working at or from home was 29%. This is markedly higher than the figure in 2019 (16%). [Table 7a and Figure 5]
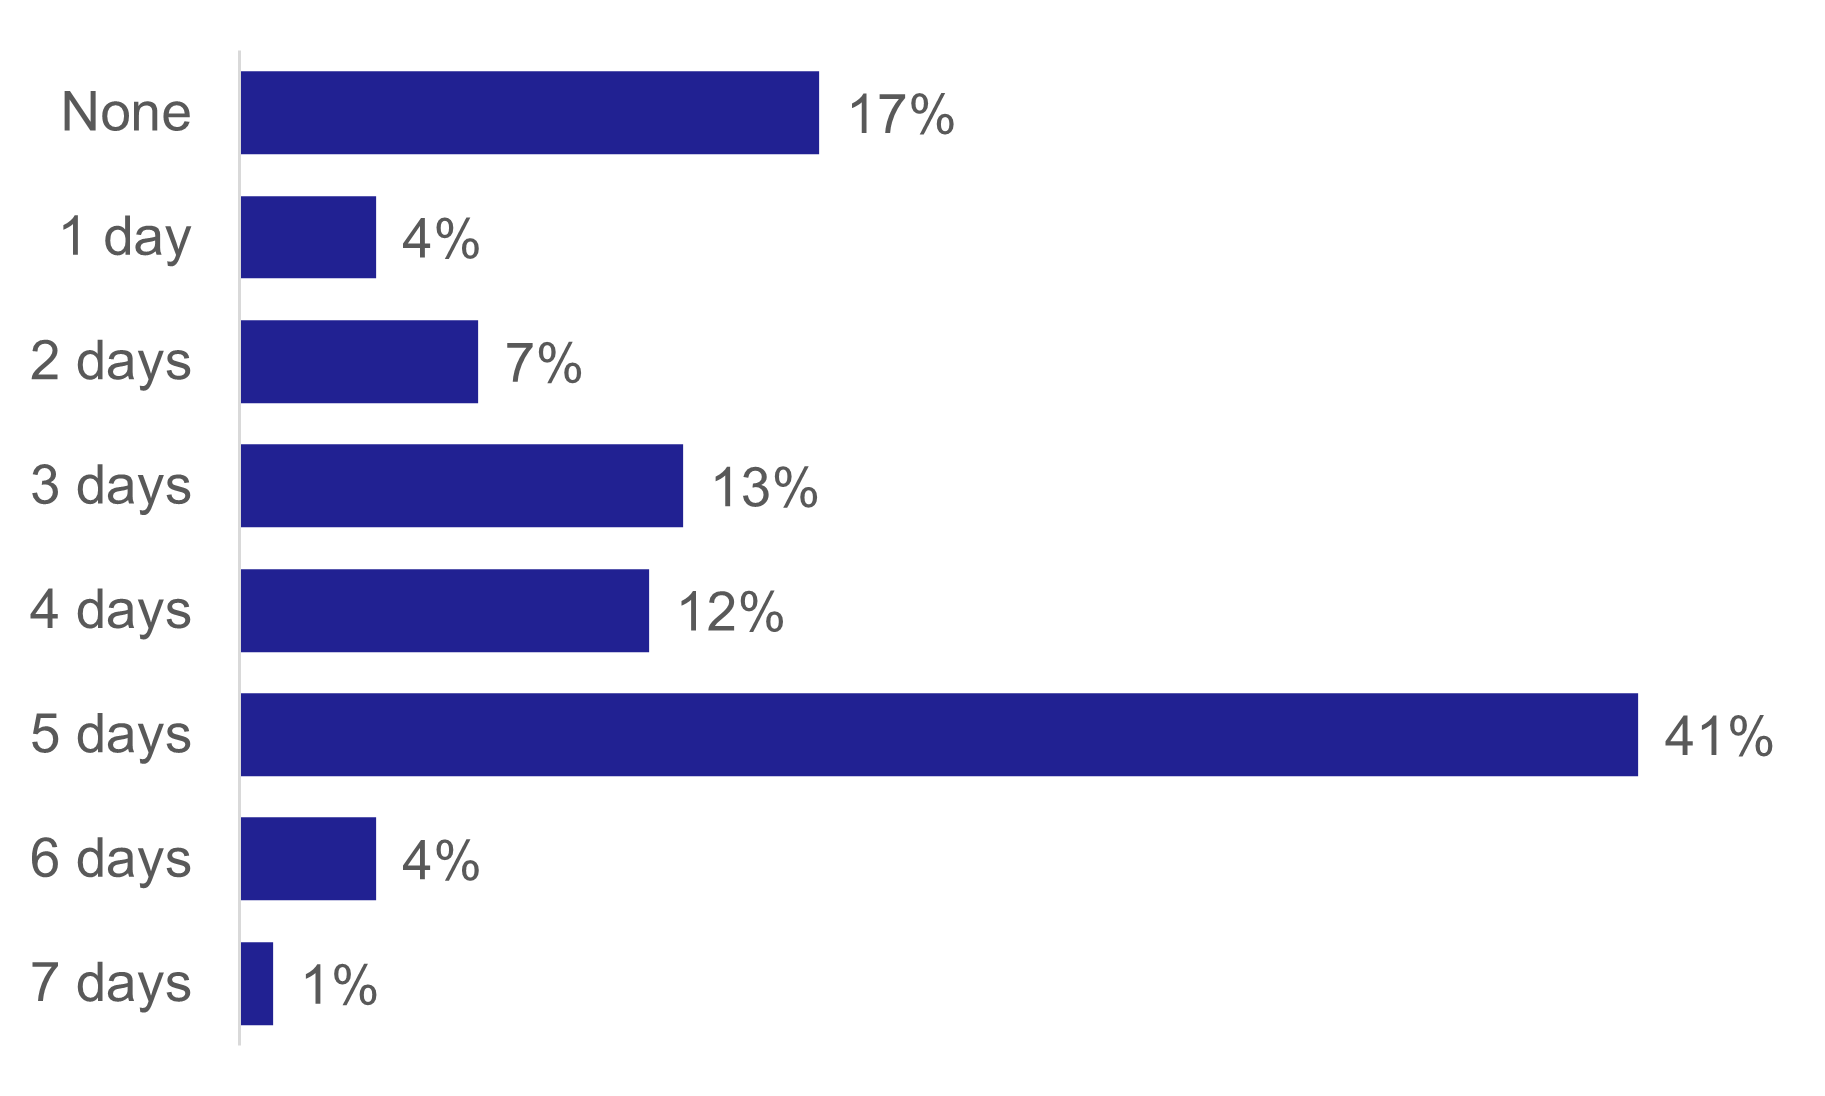
There was a slight increase in 2023 in the proportion of working people reporting travelling to work at least one day per week at 83% compared to 80% in 2022. This remains lower than in 2019 when the figure was 95%. In 2019, almost two thirds (62%) of working people travelled to work 5 days a week, but in 2023 the figure had fallen to 41%. [Table 56 and Figure 6]
How do people travel to work?
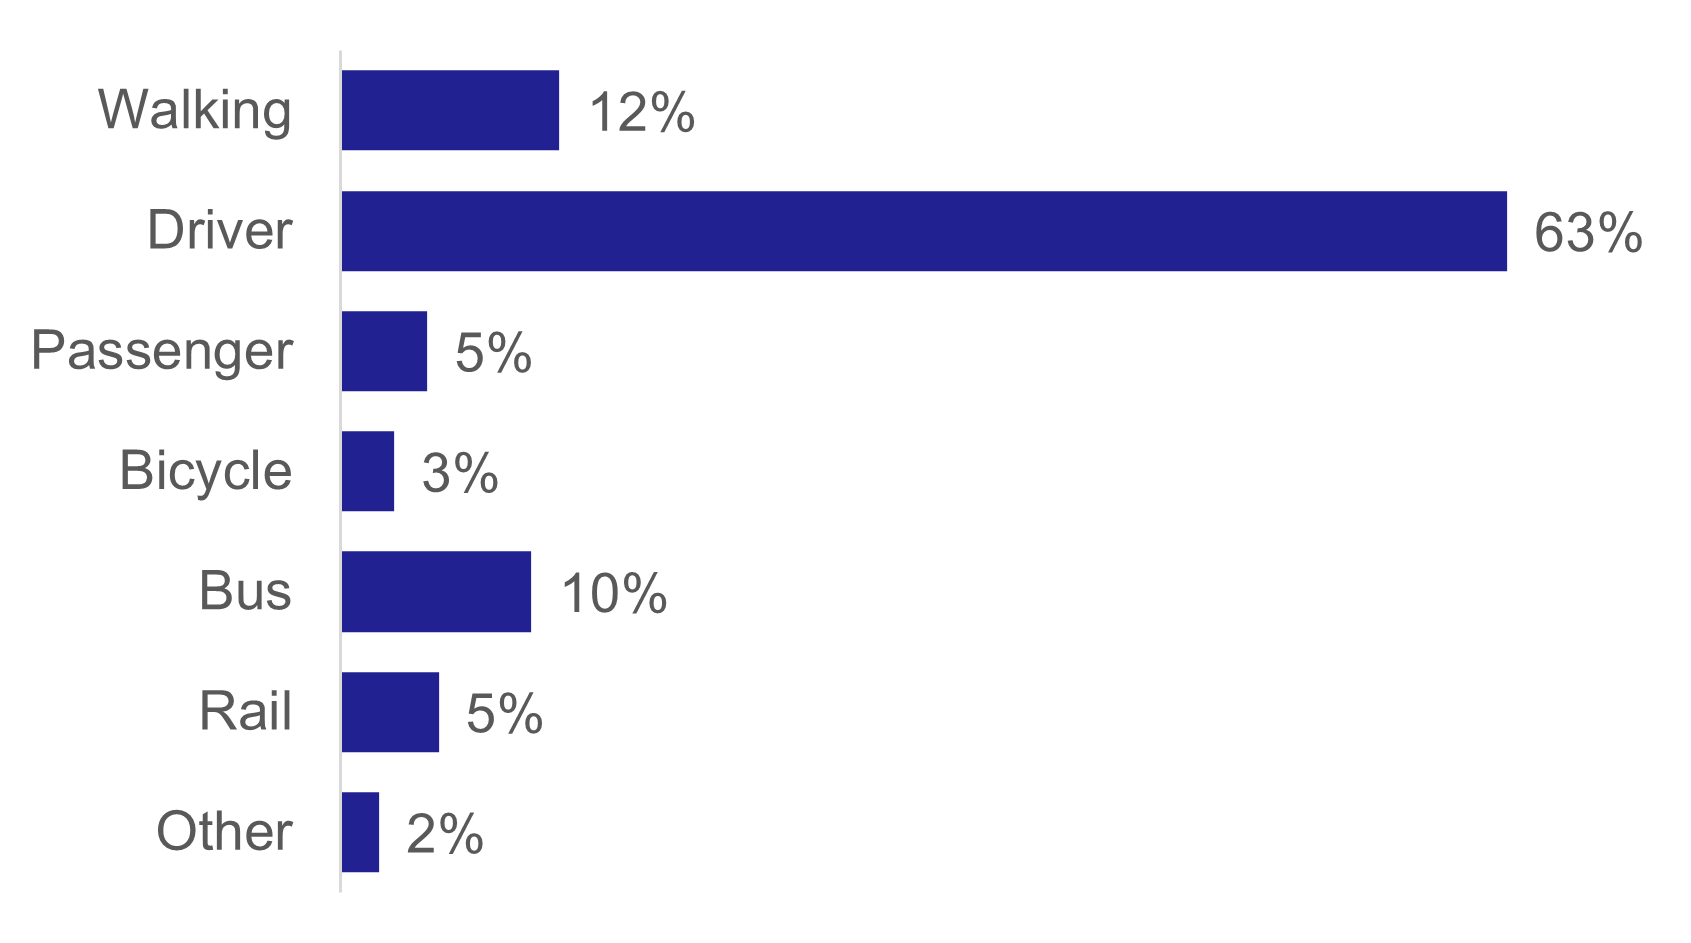
In 2023, two thirds of people who travelled to work (68%) usually travelled by car or van, usually as a driver (63%). 12% of people usually walked to work, while 10% usually took the bus. These figures are similar to 2019. [Table Sum 1, Table 7 and Figure 7]
Who travels to work by which mode?
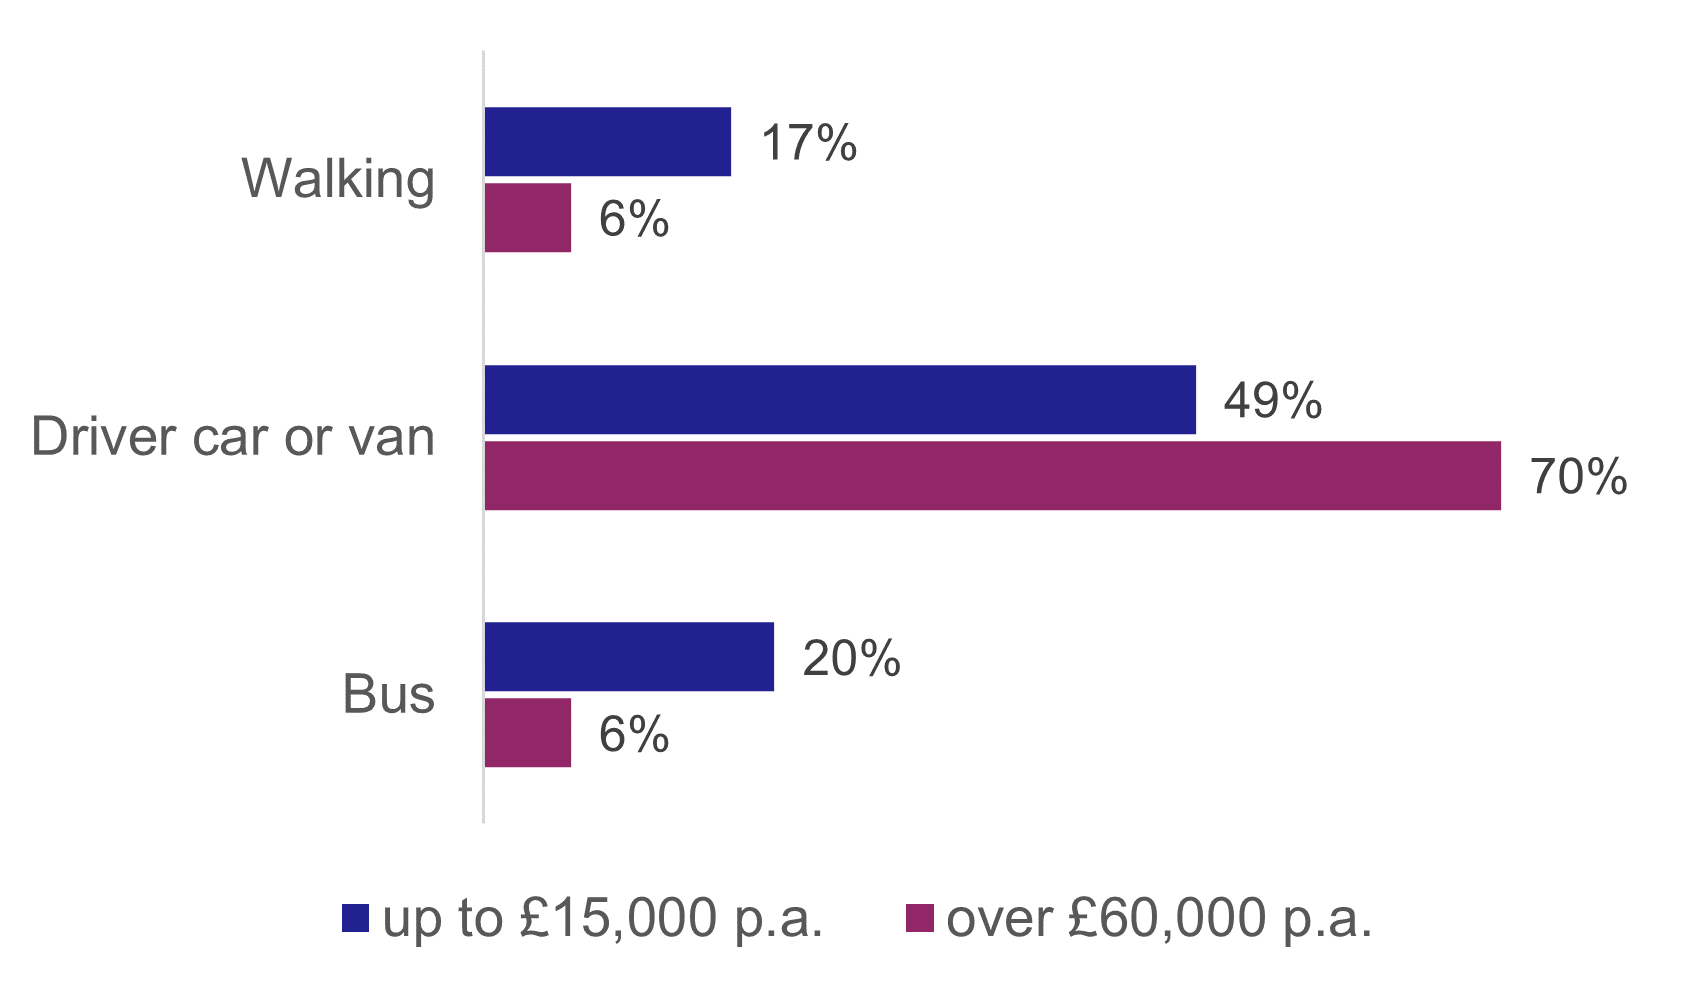
Those on a household income below £15,000 were less likely to travel by car (49%), and more likely to walk (17%) or get the bus (20%) than those with household income over £60,000 (70%, 6% and 6% respectively). [Table 7 and Figure 8]
Travel to School
How do children travel to school?
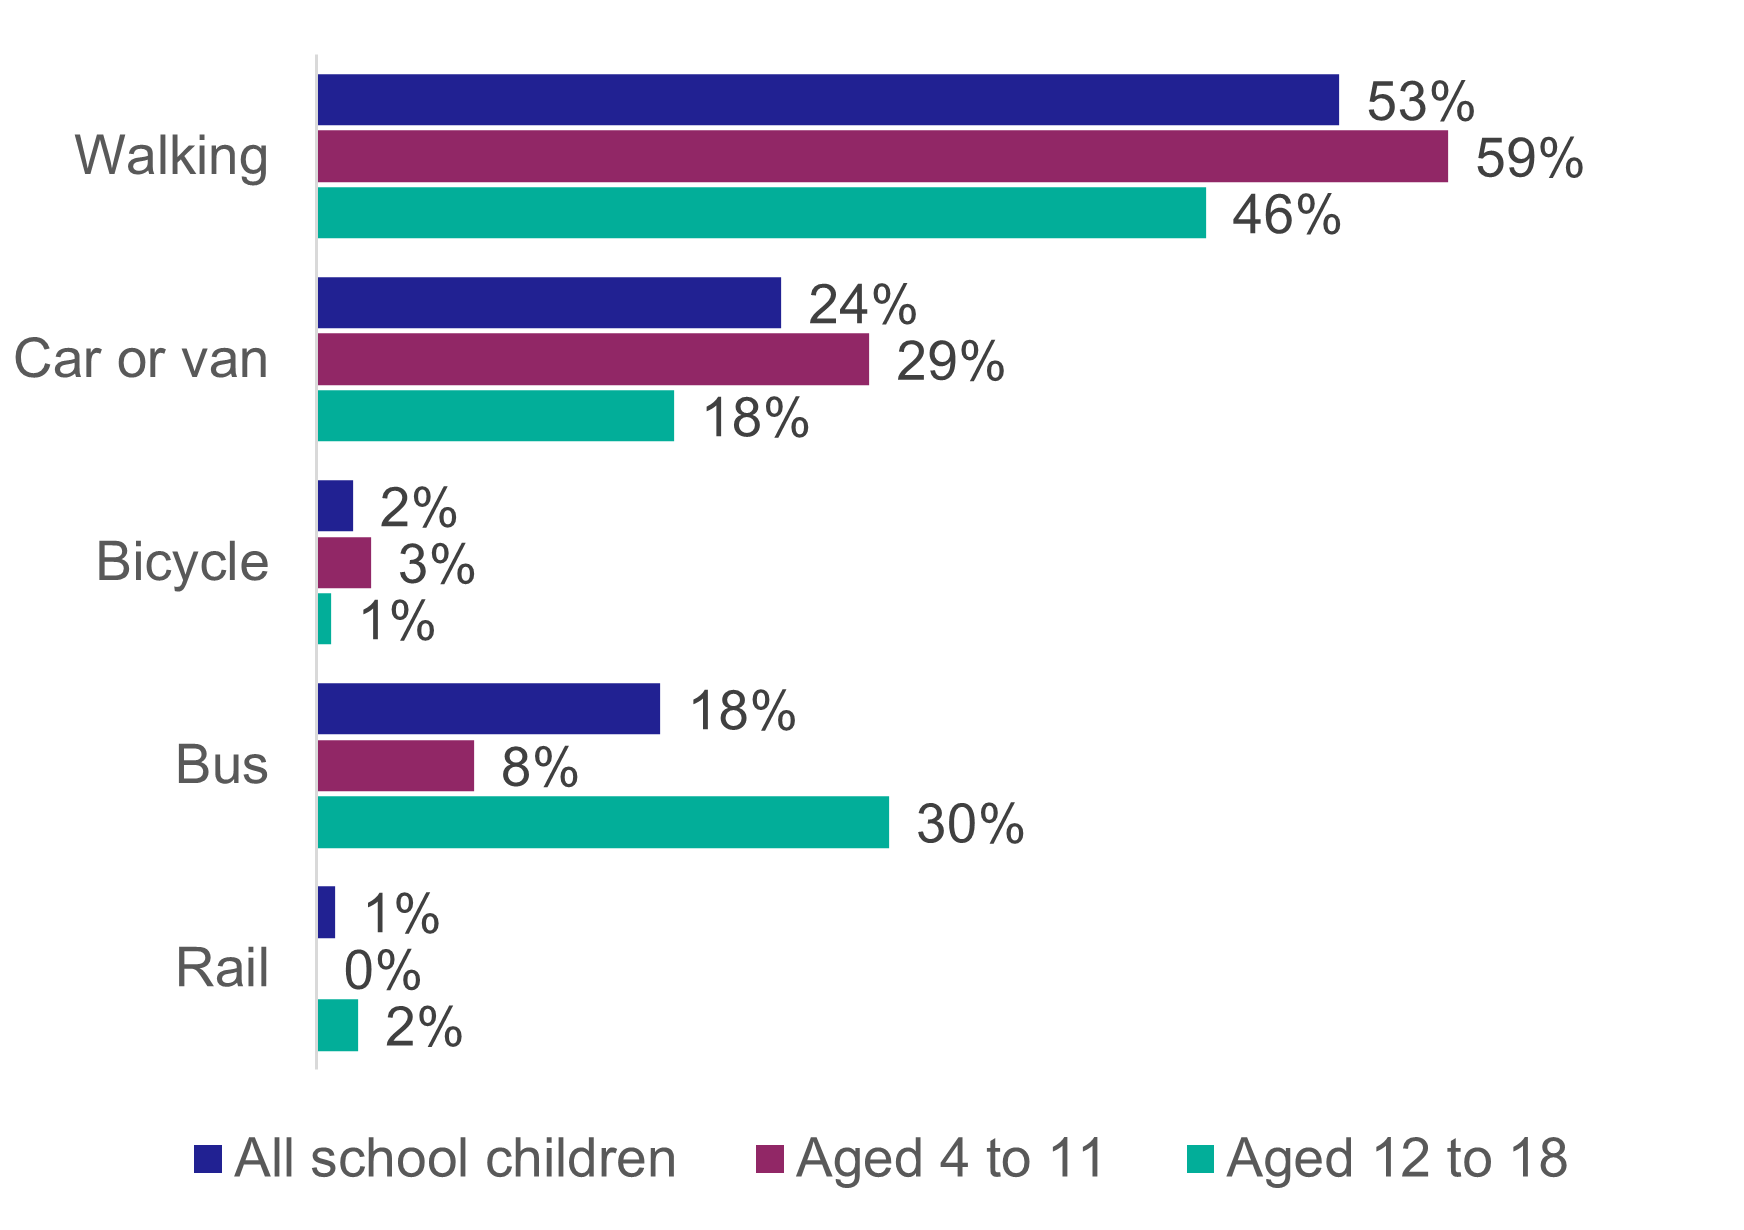
Over half of children (53%) walked to school, around a quarter (24%) travelled by car and under a fifth (18%) used a bus. There was variation in mode of travel by age. In the 4 to 11 age group, 59% reported walking to school, compared to 46% in the 12 to 18 age group. The older age group were more likely to catch a bus than younger children (29% compared to 8%). [Table 15 and Figure 9]
How long do people travel for?
Duration of travel
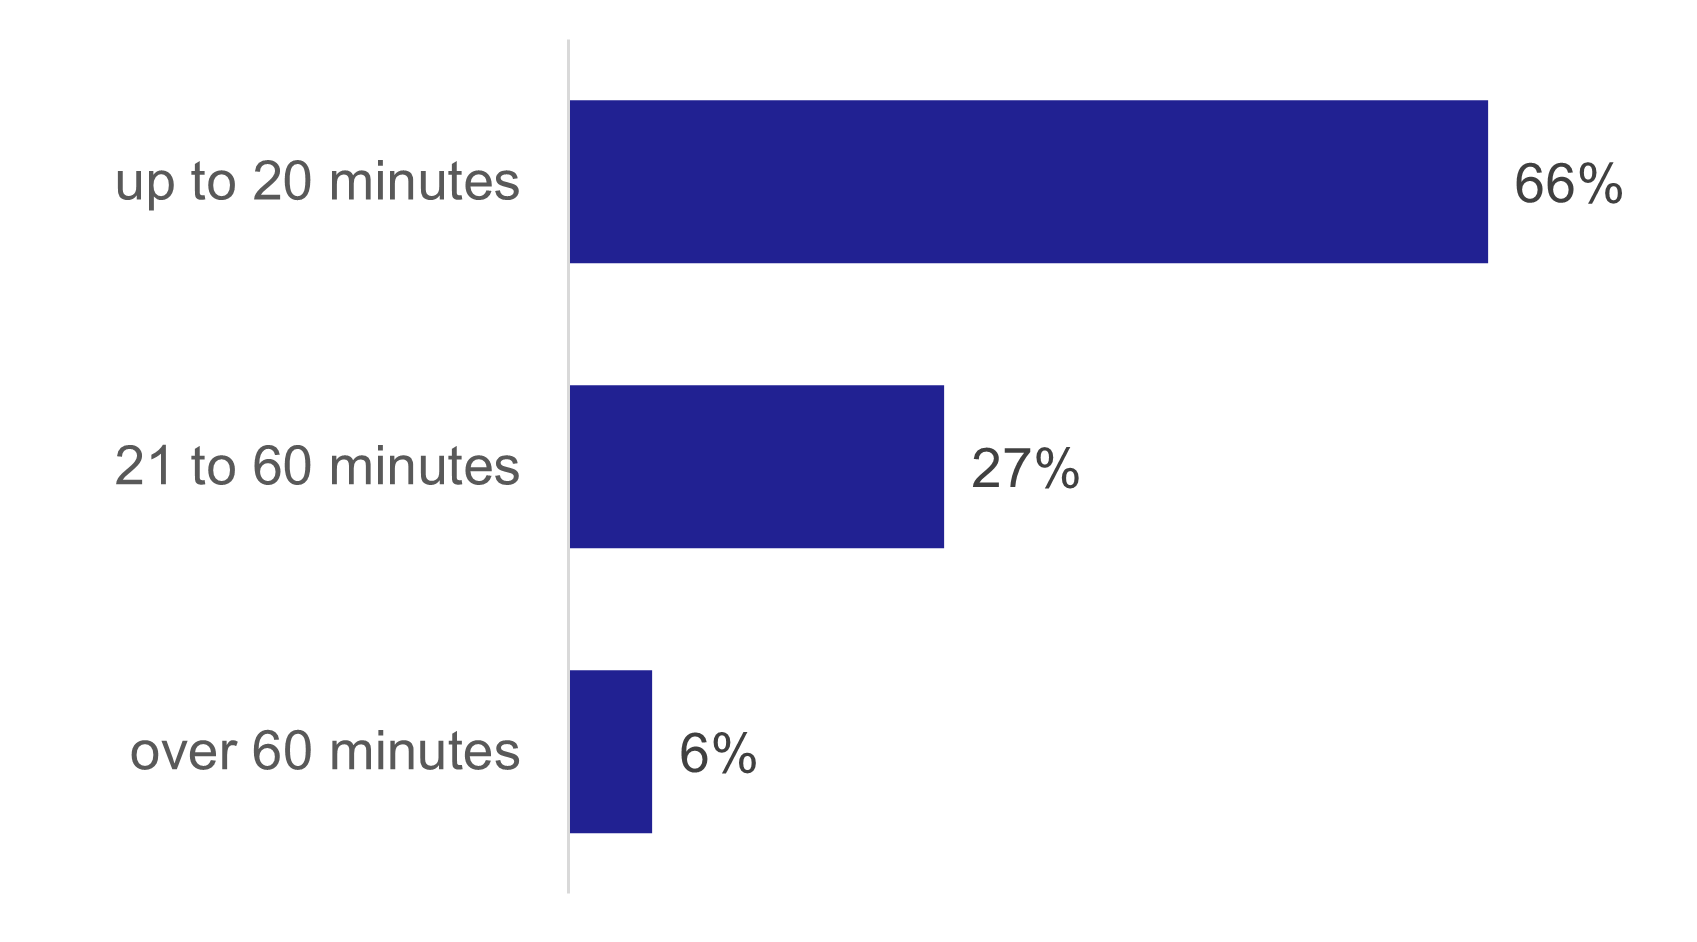
The majority of journeys reported were of short duration. 66% of journeys lasted up to 20 minutes. Only 6% lasted more than an hour. [Table TD6 and Figure 10]
Distance travelled
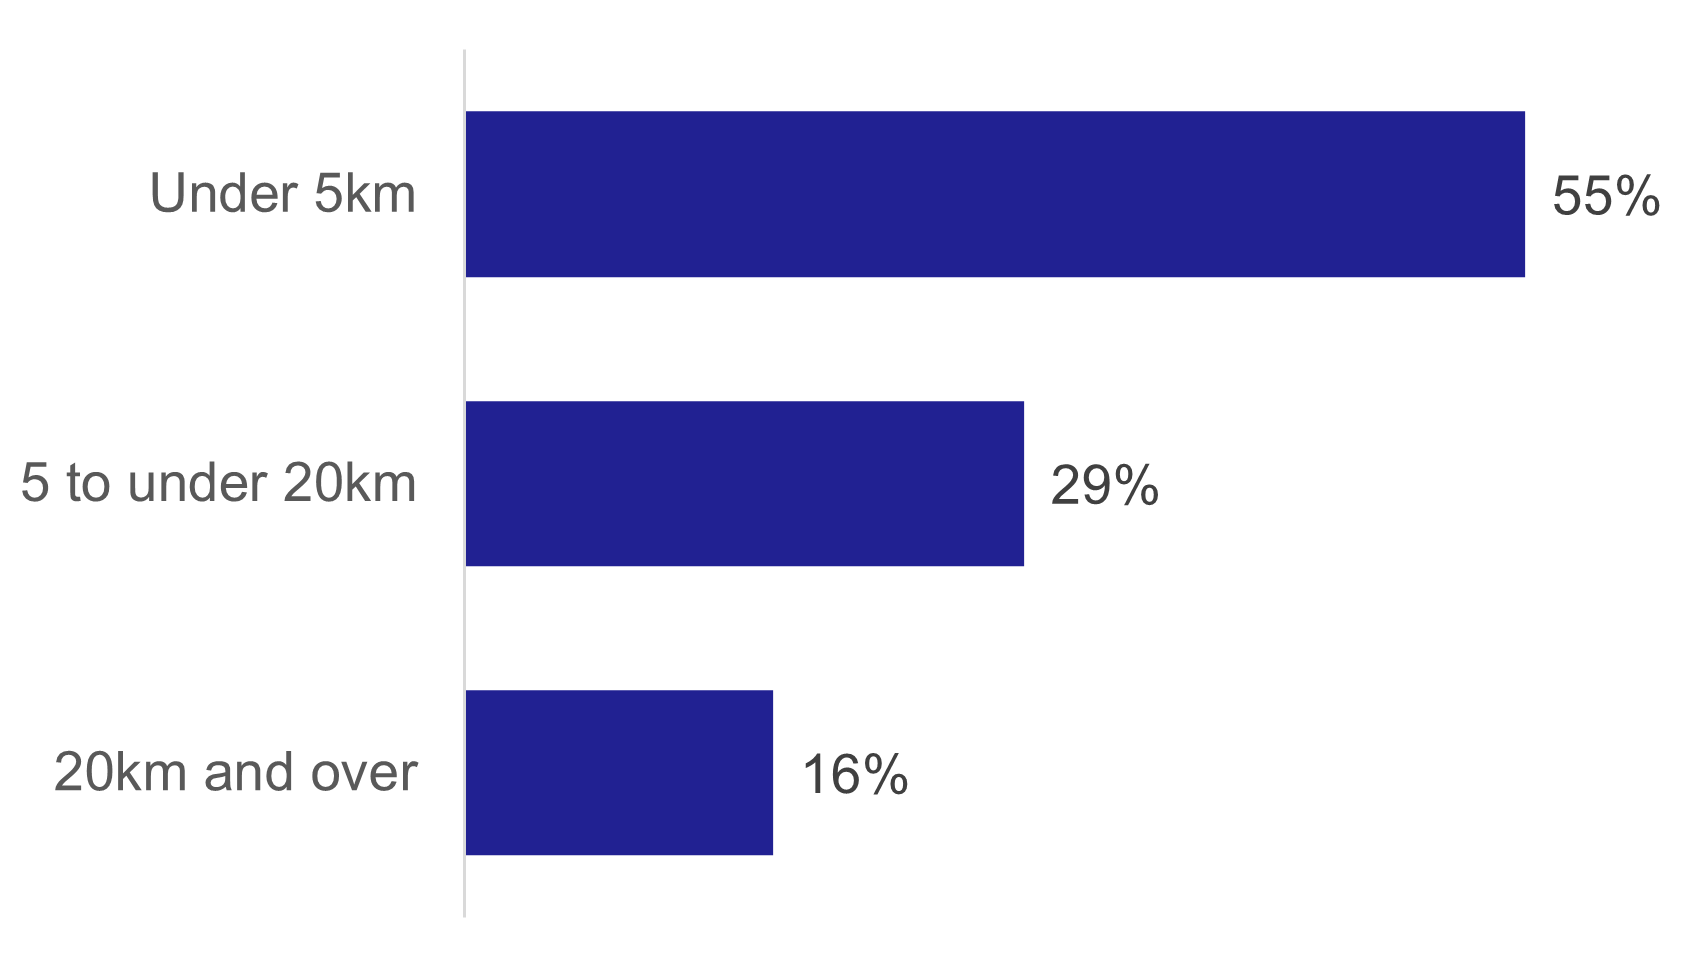
Over half (55%) of journeys were under 5 km. [Table TD4 and Figure 11]
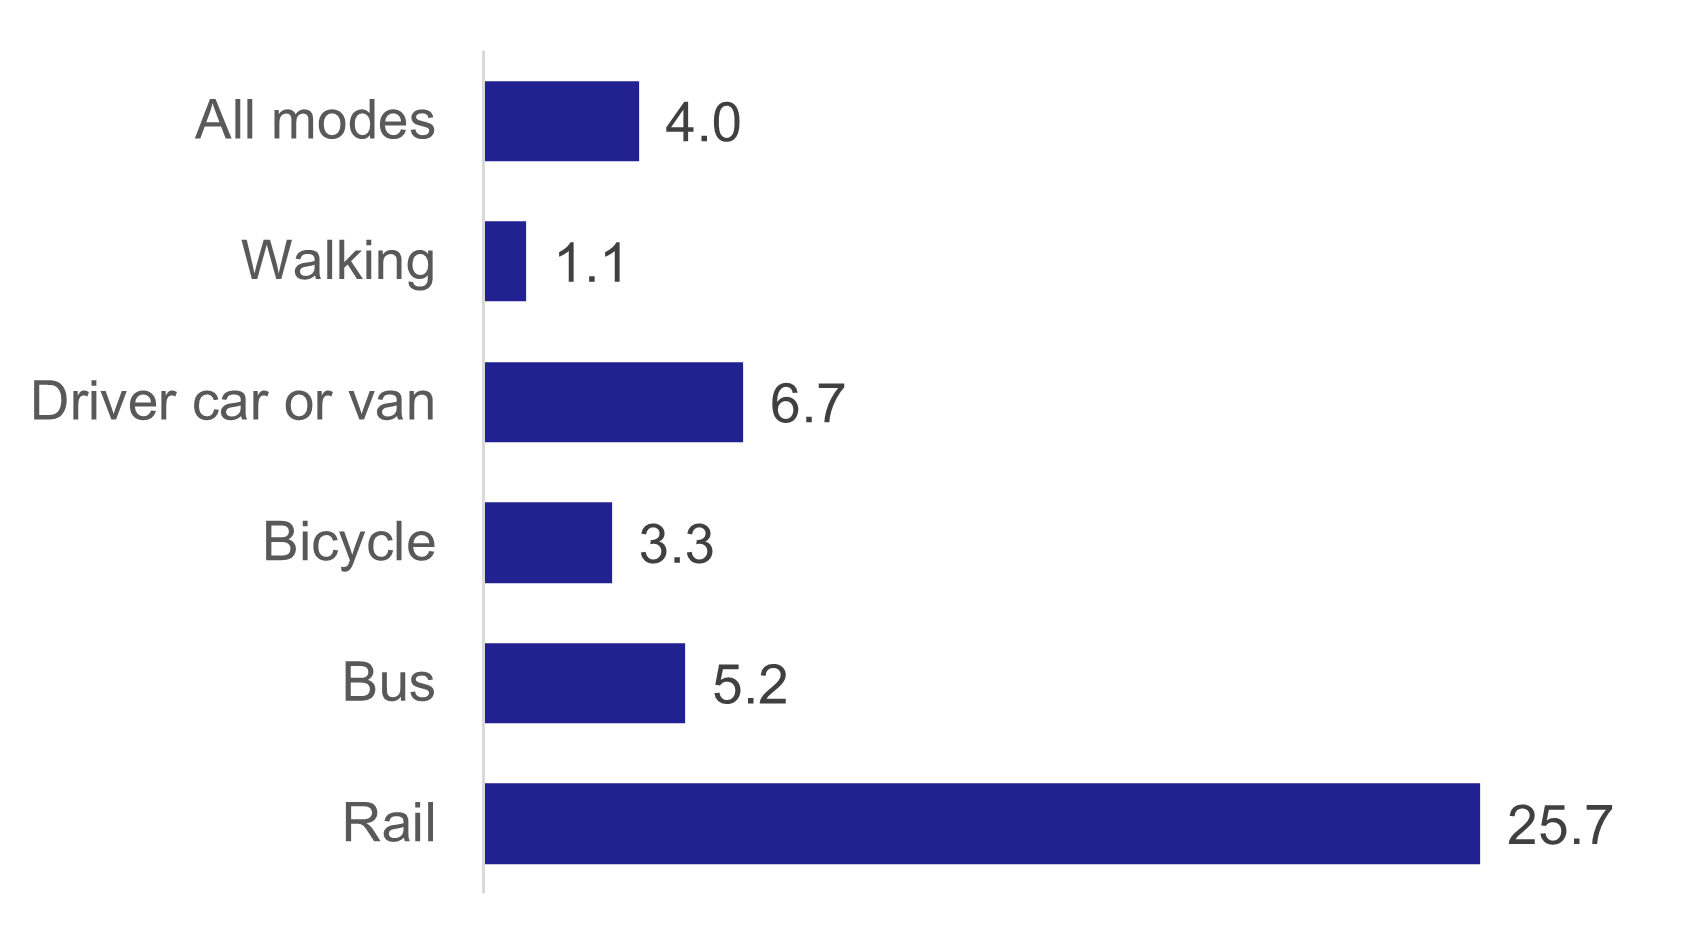
The median journey length was 4.0 km, and the mean journey length was 12.7 km. [Table TD5]
Walking journeys were an average (median) length of 1.1 km, with car driver journeys at 6.7 km and rail the longest at 25.7 km. [Table TD 5a and Figure 12]
70% of journeys under 1 km were made on foot; car journeys (whether as a driver or passenger) accounted for most of the remainder (25%). Car was the most common mode of travel for all distance groupings greater than 2 km. [Table TD2a]