Public transport
Public transport satisfaction
Satisfaction with public transport rose in 2023 (64% of respondents said they were very or fairly satisfied) compared to 2022 (58%), but was lower than in 2019 and prior years. [Table 4]
Satisfaction was higher amongst actual users of public transport (those that had used bus or train in the past month) with 74% of users reporting that they were satisfied in 2023. [Table 4b]
Satisfaction with public transport was lowest in rural areas. Satisfaction rates for those living in remote rural and accessible rural areas (47% and 46% respectively) contrasted with a satisfaction rate of 72% for those living in large urban areas.
Local bus services
38% of survey respondents had used the bus in the past month. The percentage using the bus everyday or almost every day was 7%. This was an increase on 2022 (5%), but still lower than in 2019 and prior years. [Table SUM1, Table 28a]
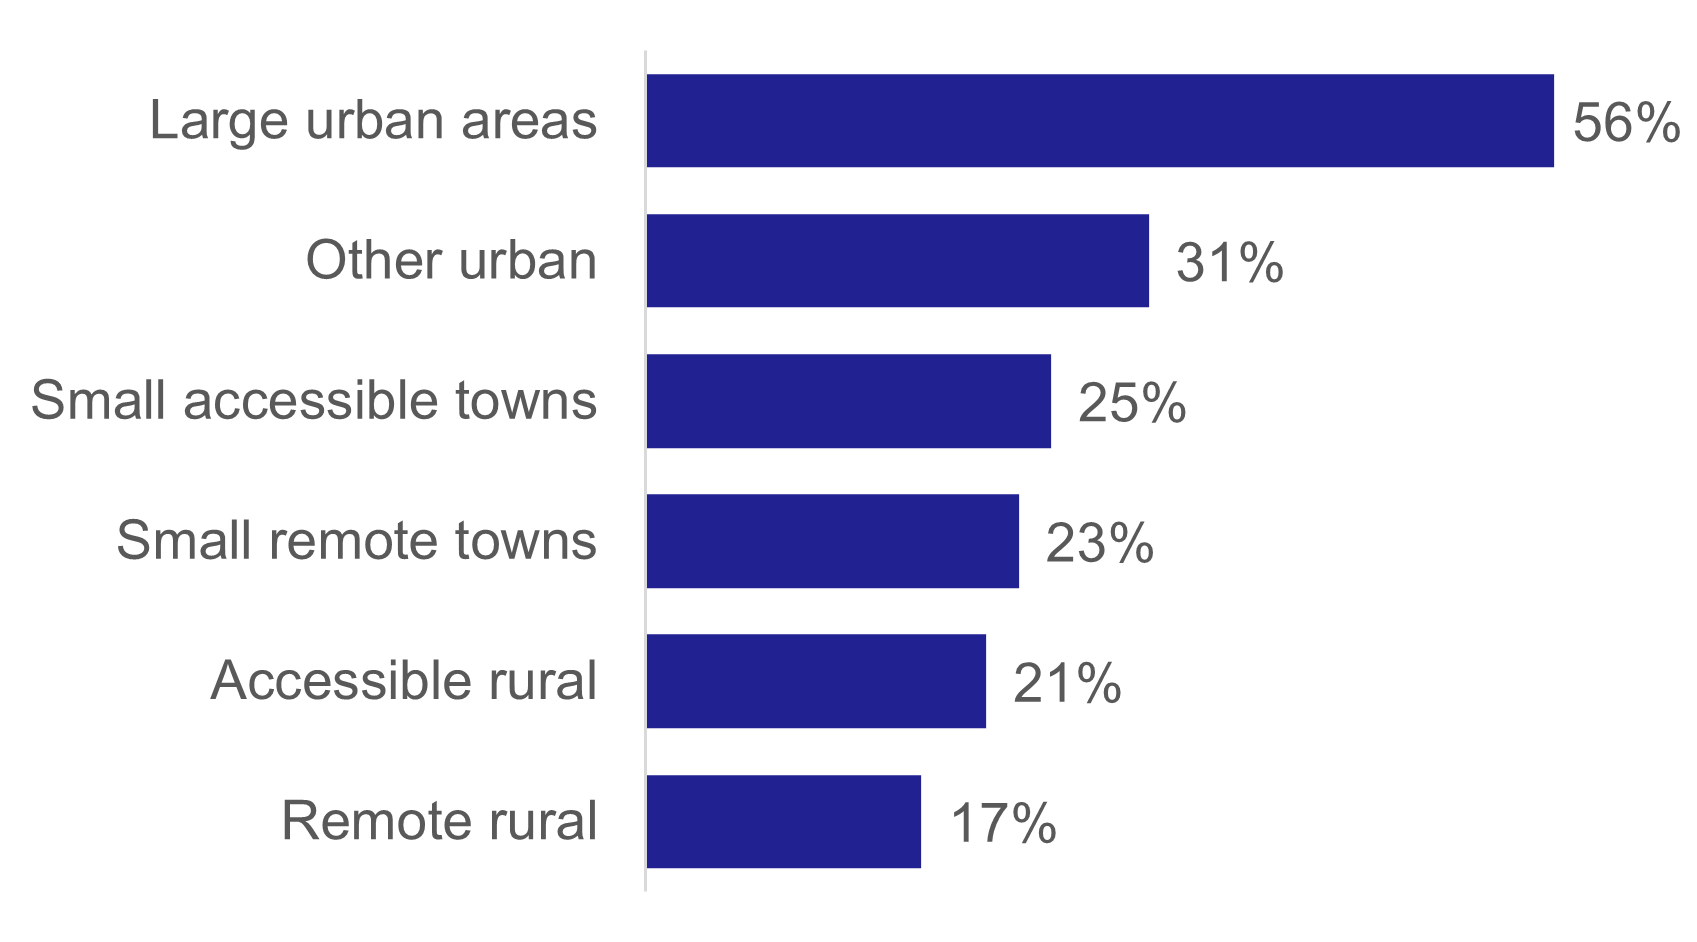
Frequency of bus use was higher in urban areas: 56% of people in large urban areas used the bus at least once a month compared to 17% in remote rural areas. [Table 28a and Figure 15]
Views on bus services
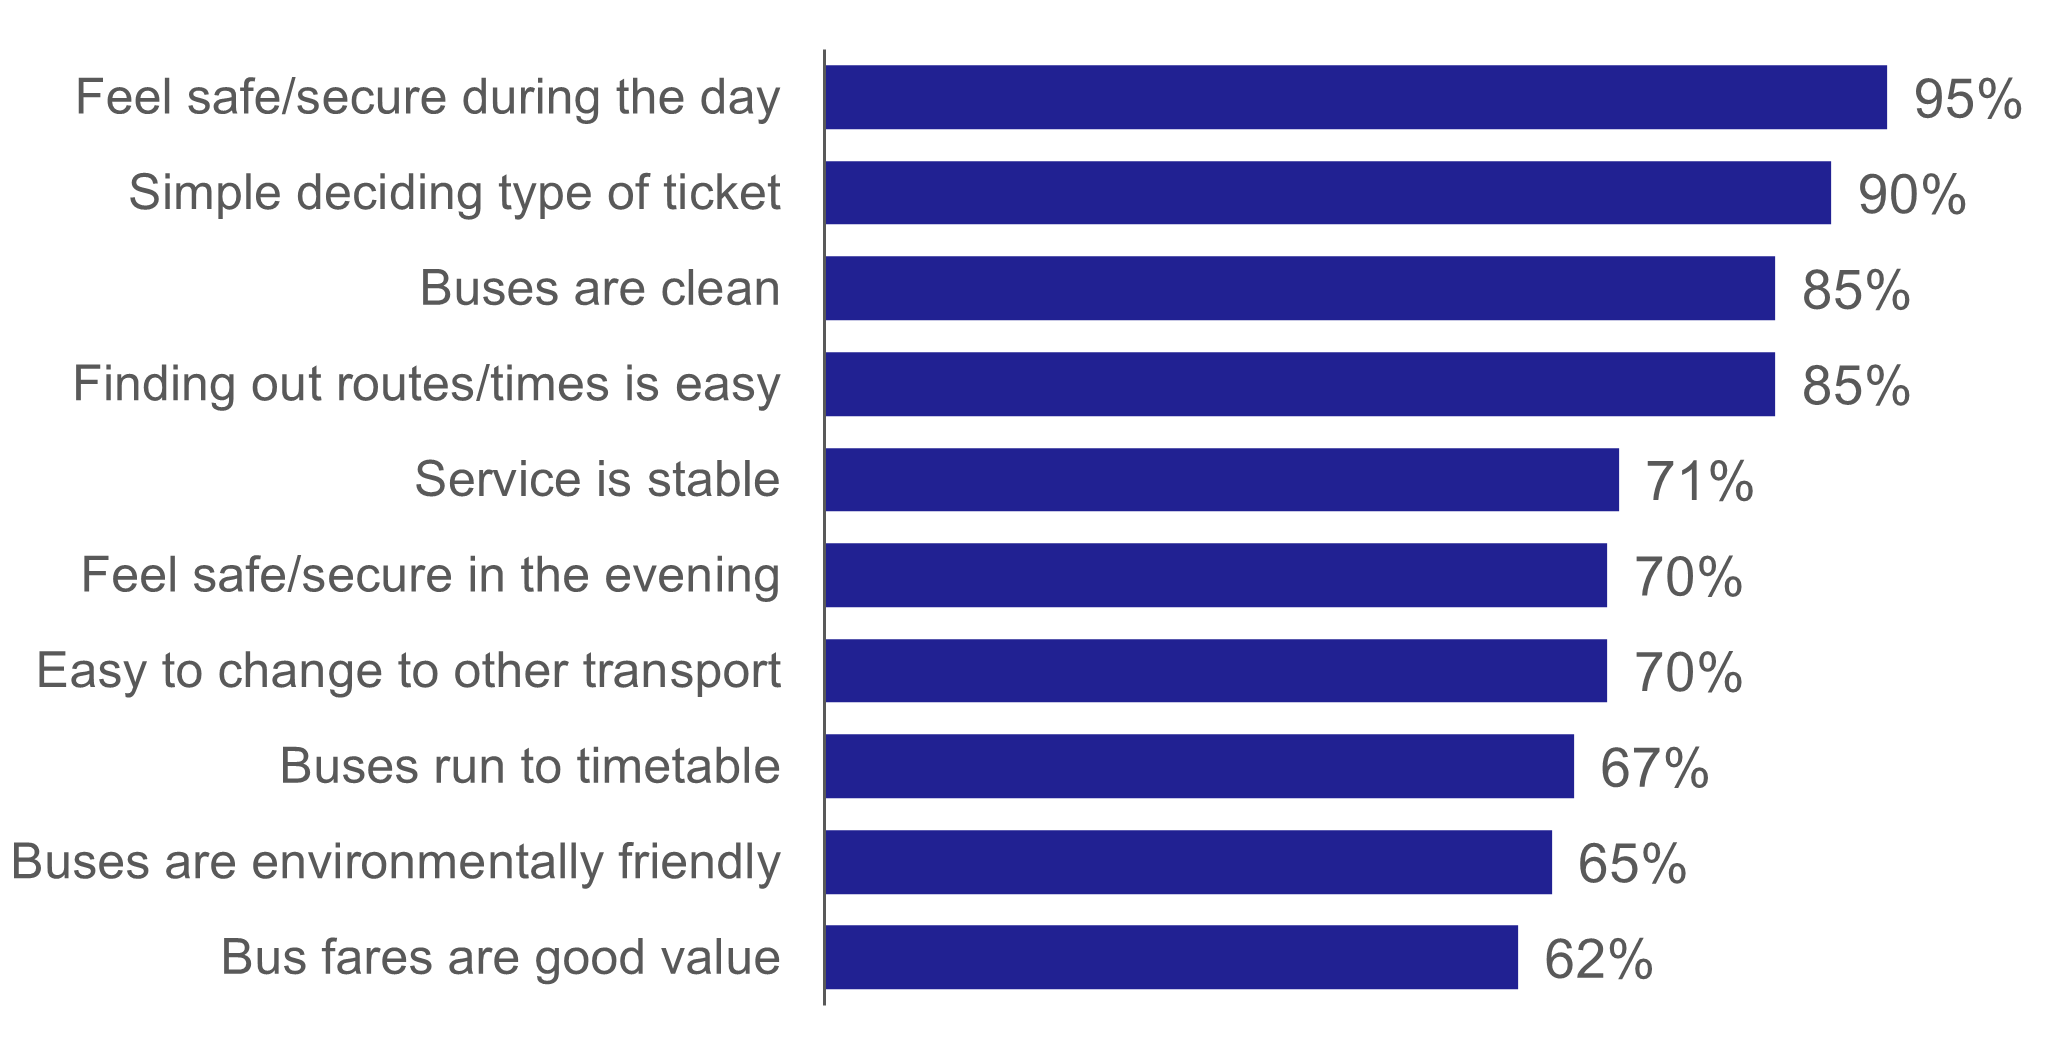
Bus users were asked whether they agreed with a number of statements about their bus service. They were most likely to agree that they felt safe or secure on the bus during the day (95% of users agreed), but were less likely to agree that they felt safe or secure using the bus during the evening (70%). Less than two thirds (62%) of users agreed that fares were good value. Almost a quarter of users (24%) disagreed that buses run to timetable. [Table 29 and Figure 16]
Rail travel
Over a quarter (28%) of survey respondents had used the train in the last month, which is an increase from 24% in the previous year. [Table 28b, Table SUM1]
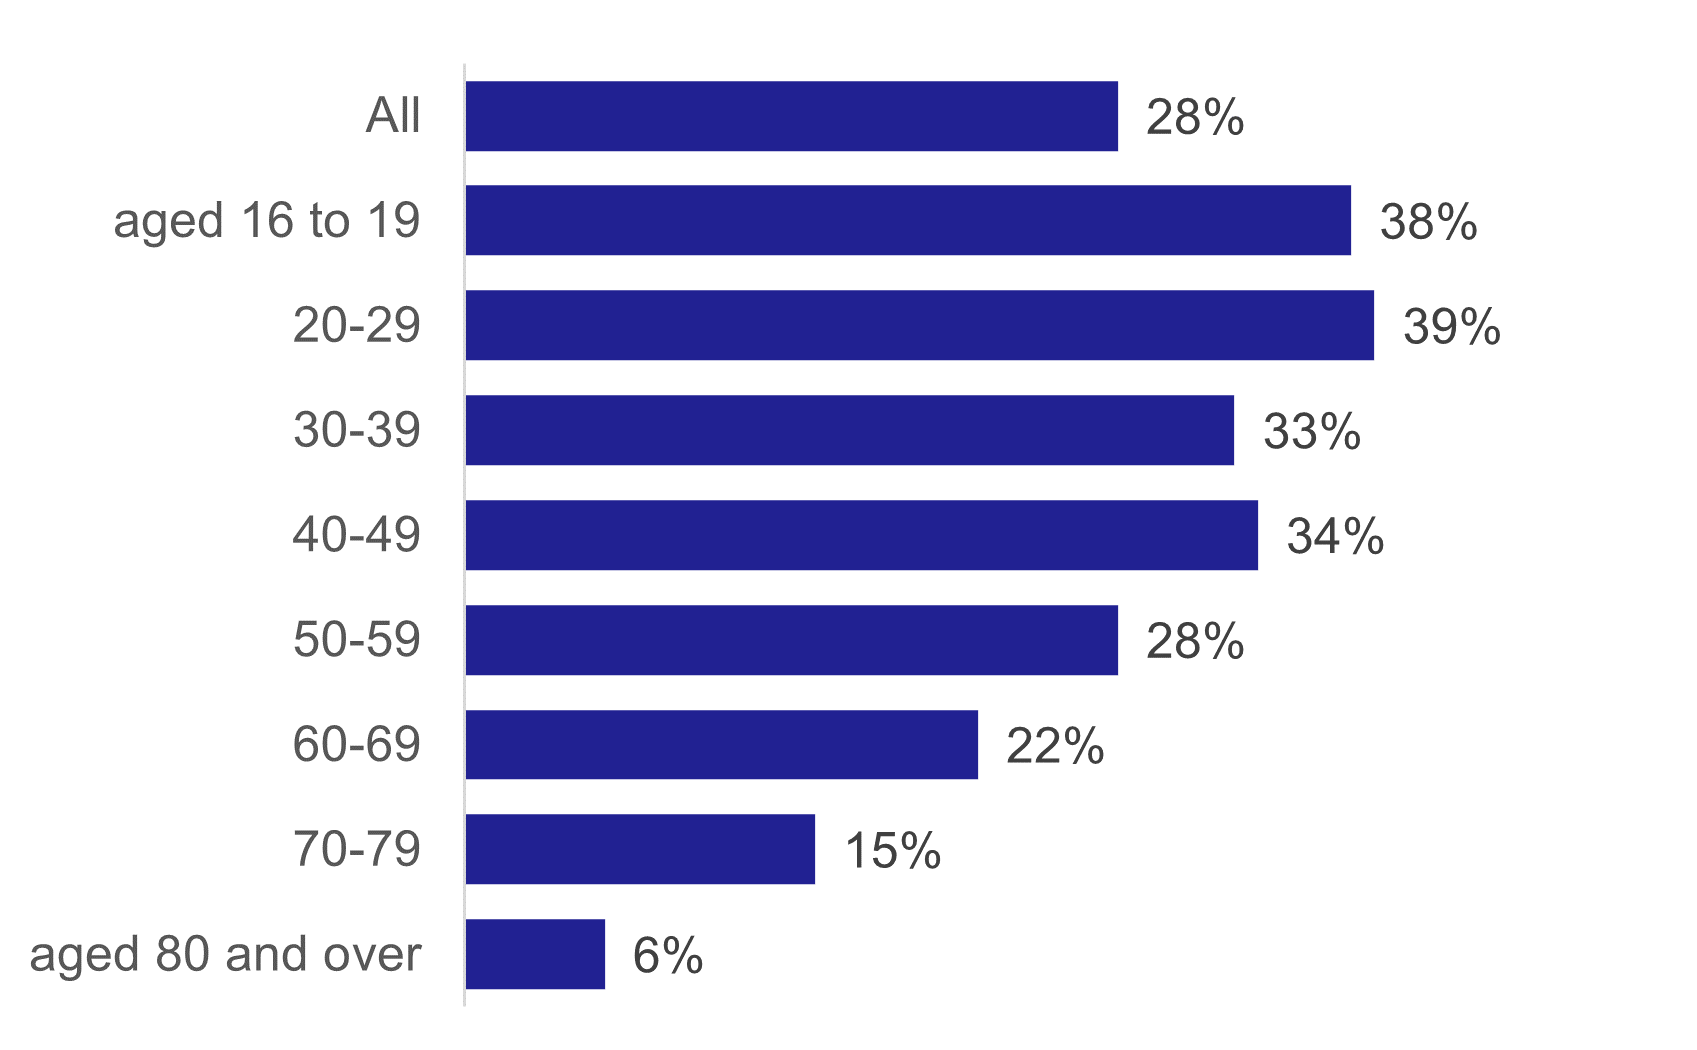
The proportion of people who reported that they had used the train in the last month decreased with age: 38% of those aged 16-19 and 39% aged 20-29 had used the train in the last month, compared to 15% aged 70 to 79 and 6% of those aged 80 and over. [Table 28b and Figure 17]
Of those who had used the train in the last month, the most frequent journey purpose was visiting friends or relatives (31%) followed by shopping (30%). [Table 44]
Views on rail services
Rail users were asked whether they agreed with a number of statements about their rail services. A high percentage of rail users agreed that they felt safe or secure using the train during the day (96%). A third of rail users (33%) disagreed that train fares were good value. [Table 30 and Figure 18]
Public transport cost
The average amount spent by an adult on public transport in 2023 was £2.80 per week. Most people (82%) spent nothing. This includes those who do not use public transport and holders of a pass for free travel. [Table 53]
For those who said they used public transport at least once a week, the average spent was £7.40 per week and 56% spent nothing (this will include free pass holders). [Table 53]
Affordability of transport
70% of people said their transport costs were either fairly easy or very easy to afford. This is an increase from 2022 (64%).
Those in households on incomes up to £10,000 were less likely to consider their costs affordable (57%). [Table 54]
54% of respondents said that transport costs affected the method of travel they used. [Table 55]