Disruption due to severe weather
Experience of severe weather disruption
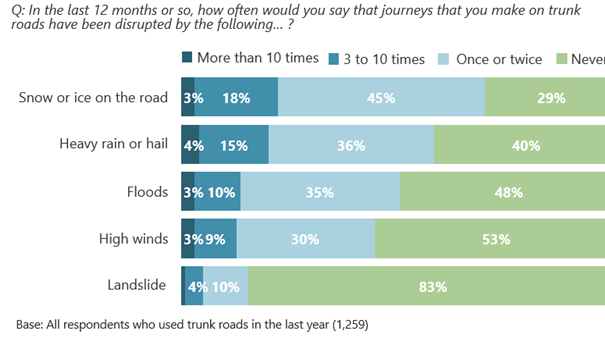
Four in five respondents (81%) said that, in the past 12 months or so, at least one of their journeys had been disrupted by severe weather.
As in 2019, disruption due to snow or ice was the most frequently encountered (66%), with landslides the least (14%). Respondents were more likely to report having a journey disrupted at least once by all five severe weather types listed when compared to 2019 (Figure 7.1).
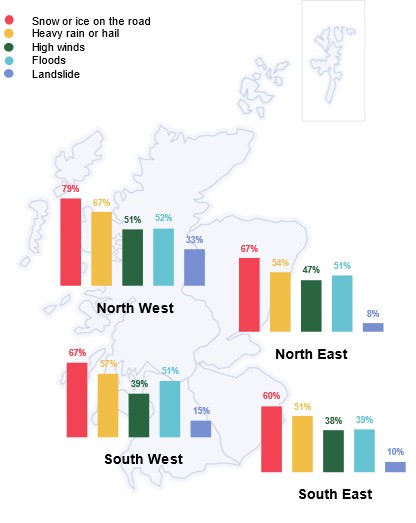
Respondents in the North West were much more likely to have experienced disruption from landslides (33%, compared with 14% overall), from snow and ice (79%, compared with 66% overall) and from heavy rain and hail (67%, compared with 56% overall). Respondents in the South East were the least likely to have experienced disruption due to floods (39%, compared with 48% overall). Respondents in the North East and South East were less likely to have experienced disruption due to landslides (8% and 10% respectively, compared with 14% overall) (Figure 7.2).
Respondents who had experienced disruption due to floods were asked which specific roads were affected. The A90 and M8 were the most common occurrences (15% and 12% respectively).
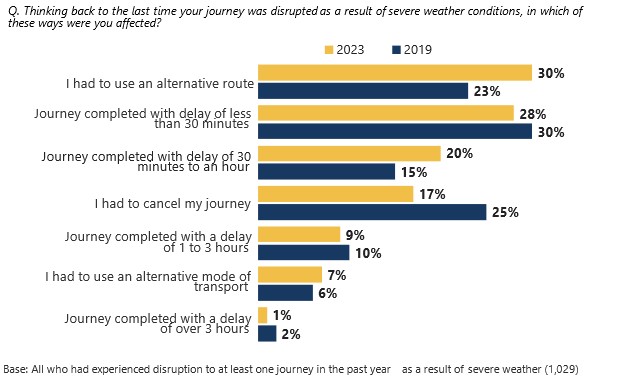
Of those who experienced a disruption due to severe weather, 58% experienced a delay to a journey that they were eventually able to make. Seventeen per cent had to cancel a journey, a decrease from 25% in 2019 (Figure 7.3).
Sources of information about conditions before, during and after severe weather
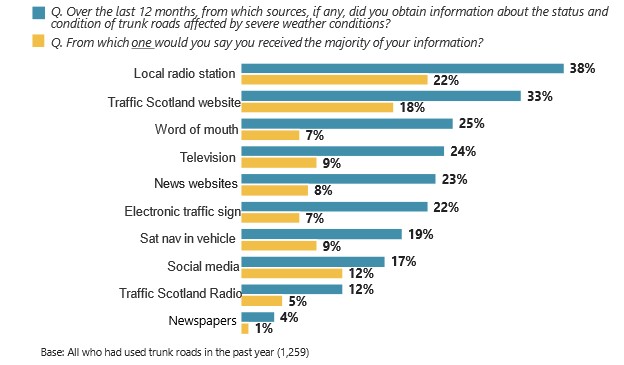
The most common sources of information on the condition of trunk roads affected by severe weather were local radio (38%), the Traffic Scotland website (33%), television (24%) and news websites (23%). When pressed for one source used for the majority of information, around one in five opted for each of local radio (22%) and the Traffic Scotland website (18%).
The use of online sources had increased since 2019 – the Traffic Scotland website (33%, compared with 18% in 2019) and news websites (23%, compared with 12% in 2019) (Figure 7.4).
Respondents in the North West were more likely to use television as a source of information about severe weather impacting road conditions (45%, compared with 33% overall) while those aged 65 and over were more likely to consult Traffic Scotland radio (15%, compared with 12% overall).
Satisfaction with information about conditions before, during and after severe weather
Respondents were more likely to be satisfied than dissatisfied with the quality of information about severe weather affecting trunk roads (Figure 7.5).
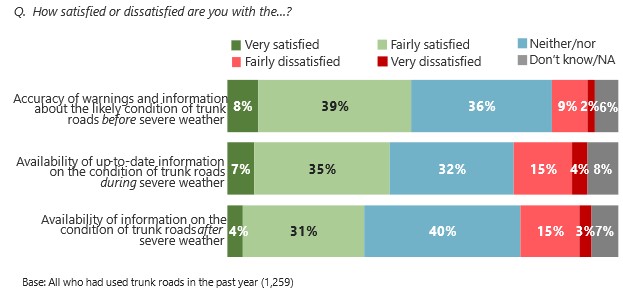
Respondents aged 55 and over were less likely than average to be satisfied with the availability of information on the condition of trunk roads after severe weather (31%, compared with 35% overall).
Satisfaction with measures to deal with severe weather disruption
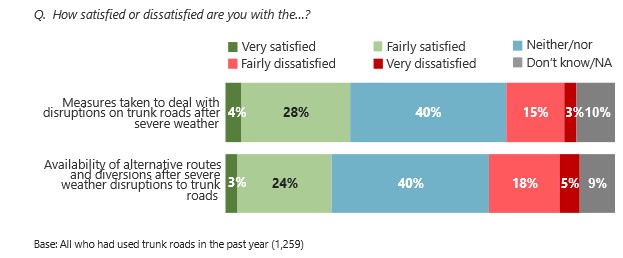
Around a third of respondents (32%) were satisfied with the measures taken to deal with disruptions after severe weather, while over a quarter (27%) were satisfied with the availability of alternative routes and diversions(Figure 7.6). Both have decreased since 2019 when levels of satisfaction were closer to half of respondents.
Respondents in the North West were more likely to be dissatisfied with the availability of alternative routes (34%, compared with 23% overall) (Figure 7.7).
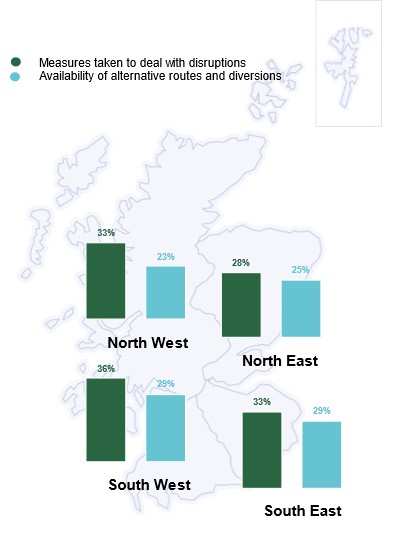
Respondents aged 55 and over were less likely to be satisfied with the measures taken to deal with disruptions from severe weather (27%, compared with 32% overall).
Weather-related travel advice warnings
More than four in five (83%) said that they understand how the current warning system works, with a similar proportion (83%) saying they follow the advice of the travel warnings. Three-quarters (75%) agreed that the recent weather warnings had been accurate. The rates of agreement were broadly in line with the 2019 data. However, fewer reported understanding the warning system (83%, compared with 91% in 2019) (Figure 7.8).
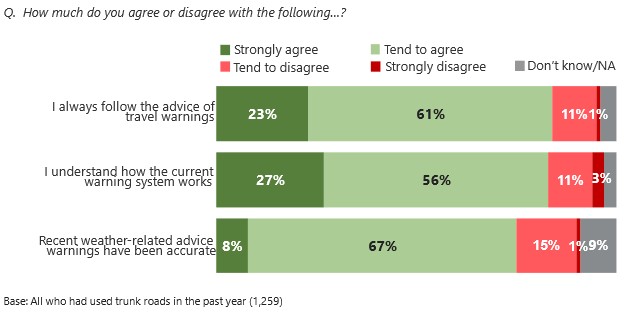
Younger respondents, aged 18-24, were least likely to say that they understood the current system of weather warnings (64%, compared with 83% overall). Older respondents, aged 55 and over, were the most likely to say that they follow the advice of travel warnings (89%, compared with 83% overall).